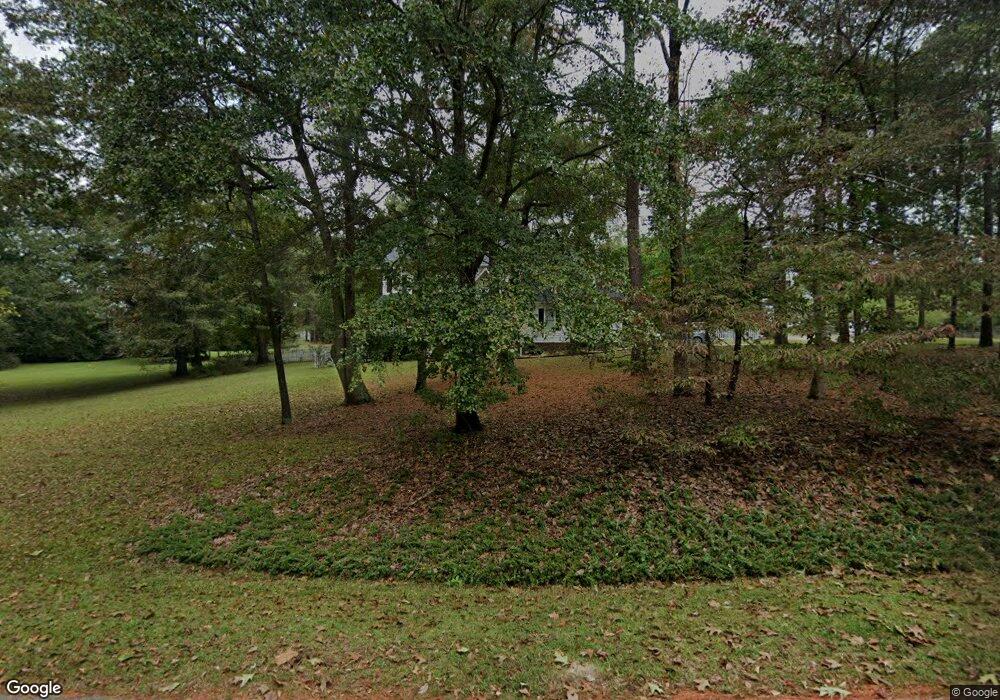
5516 Prescott Downs Dr Fuquay Varina, NC 27526
Estimated Value: $532,000 - $574,000
3
Beds
3
Baths
2,293
Sq Ft
$240/Sq Ft
Est. Value
About This Home
This home is located at 5516 Prescott Downs Dr, Fuquay Varina, NC 27526 and is currently estimated at $550,995, approximately $240 per square foot. 5516 Prescott Downs Dr is a home located in Wake County with nearby schools including Buckhorn Creek Elementary, Fuquay-Varina High, and Southern Wake Academy.
Ownership History
Date
Name
Owned For
Owner Type
Purchase Details
Closed on
Jun 12, 2014
Sold by
Bunn William H and Bunn Robin H
Bought by
Maskell Brian Edward and Maskell Alison Carrie Wright
Current Estimated Value
Home Financials for this Owner
Home Financials are based on the most recent Mortgage that was taken out on this home.
Original Mortgage
$239,923
Outstanding Balance
$183,583
Interest Rate
4.36%
Mortgage Type
New Conventional
Estimated Equity
$367,412
Purchase Details
Closed on
Jun 13, 2002
Sold by
Hood Frank O and Hood Pamela
Bought by
Bunn William H and Bunn Robin H
Home Financials for this Owner
Home Financials are based on the most recent Mortgage that was taken out on this home.
Original Mortgage
$174,800
Interest Rate
6.77%
Purchase Details
Closed on
Oct 27, 1998
Sold by
Kullmann William J
Bought by
Hood Frank O
Home Financials for this Owner
Home Financials are based on the most recent Mortgage that was taken out on this home.
Original Mortgage
$158,000
Interest Rate
6.61%
Create a Home Valuation Report for This Property
The Home Valuation Report is an in-depth analysis detailing your home's value as well as a comparison with similar homes in the area
Home Values in the Area
Average Home Value in this Area
Purchase History
| Date | Buyer | Sale Price | Title Company |
|---|---|---|---|
| Maskell Brian Edward | $253,000 | None Available | |
| Bunn William H | $218,500 | -- | |
| Hood Frank O | $197,500 | -- |
Source: Public Records
Mortgage History
| Date | Status | Borrower | Loan Amount |
|---|---|---|---|
| Open | Maskell Brian Edward | $239,923 | |
| Previous Owner | Bunn William H | $174,800 | |
| Previous Owner | Hood Frank O | $158,000 | |
| Closed | Bunn William H | $5,000 |
Source: Public Records
Tax History Compared to Growth
Tax History
| Year | Tax Paid | Tax Assessment Tax Assessment Total Assessment is a certain percentage of the fair market value that is determined by local assessors to be the total taxable value of land and additions on the property. | Land | Improvement |
|---|---|---|---|---|
| 2025 | $2,967 | $460,683 | $120,000 | $340,683 |
| 2024 | $2,881 | $460,683 | $120,000 | $340,683 |
| 2023 | $2,458 | $312,674 | $44,000 | $268,674 |
| 2022 | $2,278 | $312,674 | $44,000 | $268,674 |
| 2021 | $2,217 | $312,674 | $44,000 | $268,674 |
| 2020 | $2,181 | $312,674 | $44,000 | $268,674 |
| 2019 | $2,128 | $258,097 | $44,000 | $214,097 |
| 2018 | $1,957 | $258,097 | $44,000 | $214,097 |
| 2017 | $1,855 | $258,097 | $44,000 | $214,097 |
| 2016 | $1,818 | $258,097 | $44,000 | $214,097 |
| 2015 | $1,931 | $275,137 | $56,000 | $219,137 |
| 2014 | $1,830 | $275,137 | $56,000 | $219,137 |
Source: Public Records
Map
Nearby Homes
- 605 Hampton Crest Ct
- 301 Brindle Dr
- 1800 Phelps Rd W
- 5824 Adcock Rd
- 6625 Maggiewood Ln
- 545 Glenwyck Ct
- 542 Glenwyck Ct
- 1528 Maelyn Way
- Cooper Plan at Broadwell Trace - Broadwell Estates
- Cypress Plan at Broadwell Trace - Broadwell Estates
- 909 Wilbon Rd
- 1504 Maelyn Way
- 975 Wilbon
- 701 Laurel Spring Dr
- 713 Laurel Spring Dr
- 2504 Fleming Rd
- 945 Wilbon Rd
- 885 Wilbon Rd
- McKimmon Plan at Holston
- Winston Plan at Holston
- 5524 Prescott Downs Dr
- 6701 Humboldt Dr
- 5508 Prescott Downs Dr
- 5501 Capetian Dr
- 6700 Humboldt Dr
- 5525 Prescott Downs Dr
- 5509 Prescott Downs Dr
- 5528 Prescott Downs Dr
- 5504 Prescott Downs Dr
- 5509 Capetian Dr
- 6704 Humboldt Dr
- 5500 Capetian Dr
- 5500 Prescott Downs Dr
- 5508 Capetian Dr
- 5529 Prescott Downs Dr
- 5505 Prescott Downs Dr
- 5501 Prescott Downs Dr
- 6613 Humboldt Dr
- 5504 Capetian Dr
- 6612 Humboldt Dr