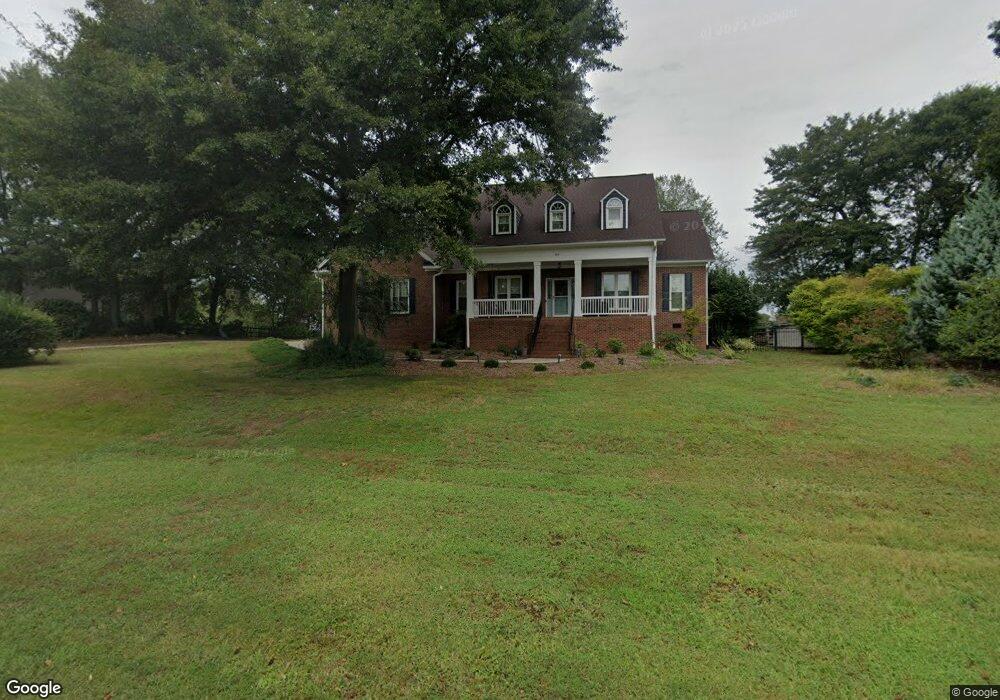
5516 Stickleback Dr Fuquay Varina, NC 27526
Estimated Value: $632,000 - $678,000
3
Beds
3
Baths
2,635
Sq Ft
$250/Sq Ft
Est. Value
About This Home
This home is located at 5516 Stickleback Dr, Fuquay Varina, NC 27526 and is currently estimated at $658,392, approximately $249 per square foot. 5516 Stickleback Dr is a home located in Wake County with nearby schools including Buckhorn Creek Elementary, Fuquay-Varina High, and Southern Wake Academy.
Ownership History
Date
Name
Owned For
Owner Type
Purchase Details
Closed on
Feb 26, 2009
Sold by
Ward Leon Jackson and Ward Tammy Peacock
Bought by
Crawford Justin and Crawford Kristen
Current Estimated Value
Home Financials for this Owner
Home Financials are based on the most recent Mortgage that was taken out on this home.
Original Mortgage
$279,837
Interest Rate
5.37%
Mortgage Type
FHA
Purchase Details
Closed on
Feb 22, 1999
Sold by
Graybuilt Llc
Bought by
Ward Leon Jackson and Ward Tammy Peacock
Home Financials for this Owner
Home Financials are based on the most recent Mortgage that was taken out on this home.
Original Mortgage
$186,450
Interest Rate
5.25%
Purchase Details
Closed on
Sep 9, 1998
Sold by
Akins Anna R
Bought by
Graybuilt Llc
Home Financials for this Owner
Home Financials are based on the most recent Mortgage that was taken out on this home.
Original Mortgage
$24,000
Interest Rate
6.95%
Create a Home Valuation Report for This Property
The Home Valuation Report is an in-depth analysis detailing your home's value as well as a comparison with similar homes in the area
Home Values in the Area
Average Home Value in this Area
Purchase History
| Date | Buyer | Sale Price | Title Company |
|---|---|---|---|
| Crawford Justin | $285,000 | None Available | |
| Ward Leon Jackson | $207,500 | -- | |
| Graybuilt Llc | $25,000 | -- |
Source: Public Records
Mortgage History
| Date | Status | Borrower | Loan Amount |
|---|---|---|---|
| Previous Owner | Crawford Justin | $279,837 | |
| Previous Owner | Ward Leon Jackson | $186,450 | |
| Previous Owner | Graybuilt Llc | $24,000 |
Source: Public Records
Tax History Compared to Growth
Tax History
| Year | Tax Paid | Tax Assessment Tax Assessment Total Assessment is a certain percentage of the fair market value that is determined by local assessors to be the total taxable value of land and additions on the property. | Land | Improvement |
|---|---|---|---|---|
| 2025 | $3,610 | $561,323 | $120,000 | $441,323 |
| 2024 | $3,506 | $561,323 | $120,000 | $441,323 |
| 2023 | $3,185 | $405,983 | $44,000 | $361,983 |
| 2022 | $2,861 | $393,355 | $44,000 | $349,355 |
| 2021 | $2,784 | $393,355 | $44,000 | $349,355 |
| 2020 | $2,738 | $393,355 | $44,000 | $349,355 |
| 2019 | $2,696 | $327,630 | $44,000 | $283,630 |
| 2018 | $2,479 | $327,630 | $44,000 | $283,630 |
| 2017 | $2,349 | $327,630 | $44,000 | $283,630 |
| 2016 | $2,302 | $327,630 | $44,000 | $283,630 |
| 2015 | $2,376 | $339,169 | $56,000 | $283,169 |
| 2014 | $2,252 | $339,169 | $56,000 | $283,169 |
Source: Public Records
Map
Nearby Homes
- 6625 Maggiewood Ln
- 605 Hampton Crest Ct
- 909 Wilbon Rd
- 545 Glenwyck Ct
- 1528 Maelyn Way
- Cooper Plan at Broadwell Trace - Broadwell Estates
- Cypress Plan at Broadwell Trace - Broadwell Estates
- 5824 Adcock Rd
- 1504 Maelyn Way
- 975 Wilbon
- 713 Laurel Spring Dr
- 701 Laurel Spring Dr
- 1800 Phelps Rd W
- 301 Brindle Dr
- 945 Wilbon Rd
- 809 Briar Gate Dr
- 885 Wilbon Rd
- 916 Briar Gate Dr
- 1017 Quindell Dr
- 1152 Summer Meadow Dr
- 5520 Stickleback Dr
- 5517 Stickleback Dr
- 5512 Stickleback Dr
- 6004 Humboldt Dr
- 5524 Stickleback Dr
- 6605 Humboldt Dr
- 5528 Stickleback Dr
- 5509 Stickleback Dr
- 6604 Humboldt Dr
- 5505 Lares Ln
- 5532 Stickleback Dr
- 5529 Stickleback Dr
- 6608 Humboldt Dr
- 6609 Humboldt Dr
- 5504 Stickleback Dr
- 6600 Wavcott Dr
- 6612 Humboldt Dr
- 6604 Wavcott Dr
- 5509 Lares Ln
- 6613 Humboldt Dr