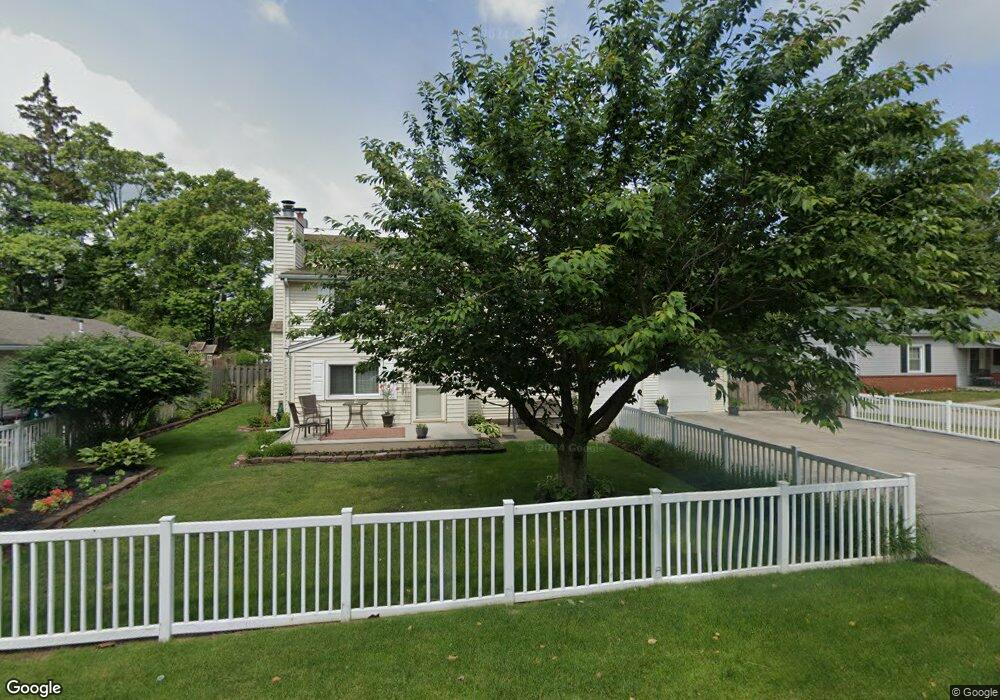
5517 Grey Dr Sylvania, OH 43560
Estimated Value: $191,000 - $247,000
3
Beds
2
Baths
1,698
Sq Ft
$130/Sq Ft
Est. Value
About This Home
This home is located at 5517 Grey Dr, Sylvania, OH 43560 and is currently estimated at $220,799, approximately $130 per square foot. 5517 Grey Dr is a home located in Lucas County with nearby schools including Whiteford Elementary School, Sylvania Arbor Hills Junior High School, and Sylvania Northview High School.
Ownership History
Date
Name
Owned For
Owner Type
Purchase Details
Closed on
Jun 16, 1995
Sold by
Gehrke Randall S
Bought by
Powers Scott and Richardson Debra J
Current Estimated Value
Home Financials for this Owner
Home Financials are based on the most recent Mortgage that was taken out on this home.
Original Mortgage
$66,500
Interest Rate
8.27%
Mortgage Type
New Conventional
Purchase Details
Closed on
May 22, 1990
Sold by
O'Malley Gary R and O'Malley Colleen
Purchase Details
Closed on
Jan 23, 1989
Sold by
Simons C I and D I
Create a Home Valuation Report for This Property
The Home Valuation Report is an in-depth analysis detailing your home's value as well as a comparison with similar homes in the area
Home Values in the Area
Average Home Value in this Area
Purchase History
| Date | Buyer | Sale Price | Title Company |
|---|---|---|---|
| Powers Scott | $70,000 | -- | |
| -- | $53,500 | -- | |
| -- | $46,500 | -- |
Source: Public Records
Mortgage History
| Date | Status | Borrower | Loan Amount |
|---|---|---|---|
| Closed | Powers Scott | $66,500 |
Source: Public Records
Tax History Compared to Growth
Tax History
| Year | Tax Paid | Tax Assessment Tax Assessment Total Assessment is a certain percentage of the fair market value that is determined by local assessors to be the total taxable value of land and additions on the property. | Land | Improvement |
|---|---|---|---|---|
| 2024 | $2,245 | $71,540 | $6,825 | $64,715 |
| 2023 | $3,132 | $43,295 | $5,390 | $37,905 |
| 2022 | $3,136 | $43,295 | $5,390 | $37,905 |
| 2021 | $3,235 | $43,295 | $5,390 | $37,905 |
| 2020 | $3,090 | $36,715 | $3,220 | $33,495 |
| 2019 | $2,973 | $36,715 | $3,220 | $33,495 |
| 2018 | $2,914 | $36,715 | $3,220 | $33,495 |
| 2017 | $3,175 | $35,875 | $3,150 | $32,725 |
| 2016 | $3,037 | $100,000 | $9,000 | $91,000 |
| 2015 | $2,860 | $100,000 | $9,000 | $91,000 |
| 2014 | $3,191 | $40,260 | $3,050 | $37,210 |
| 2013 | $3,191 | $40,260 | $3,050 | $37,210 |
Source: Public Records
Map
Nearby Homes