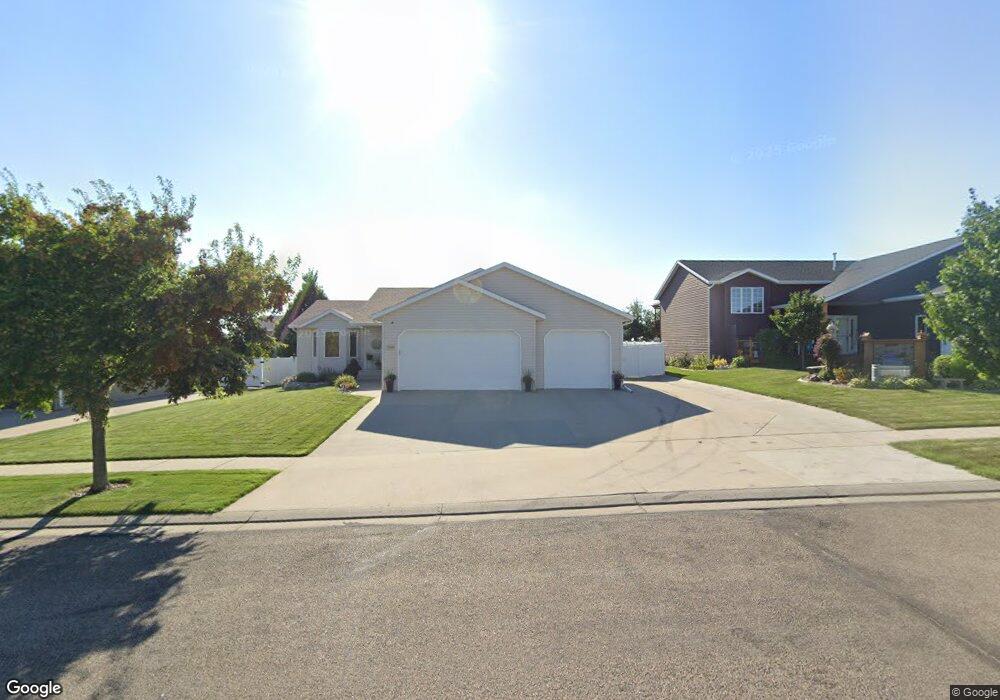
5518 Calvert Dr Bismarck, ND 58503
North Bismarck NeighborhoodEstimated Value: $385,000 - $480,000
2
Beds
2
Baths
1,354
Sq Ft
$315/Sq Ft
Est. Value
About This Home
This home is located at 5518 Calvert Dr, Bismarck, ND 58503 and is currently estimated at $426,249, approximately $314 per square foot. 5518 Calvert Dr is a home located in Burleigh County with nearby schools including Liberty Elementary School, Horizon Middle School, and Century High School.
Ownership History
Date
Name
Owned For
Owner Type
Purchase Details
Closed on
Mar 11, 2013
Sold by
Brew Marissa and Brew Nicholas
Bought by
Brew Nicholas and Brew Marissa
Current Estimated Value
Home Financials for this Owner
Home Financials are based on the most recent Mortgage that was taken out on this home.
Original Mortgage
$220,150
Outstanding Balance
$152,303
Interest Rate
3.49%
Mortgage Type
New Conventional
Estimated Equity
$273,946
Purchase Details
Closed on
Sep 4, 2009
Sold by
Marchus Homes Inc
Bought by
Moszer Marissa and Brew Nicholas
Home Financials for this Owner
Home Financials are based on the most recent Mortgage that was taken out on this home.
Original Mortgage
$193,903
Interest Rate
5.27%
Mortgage Type
New Conventional
Purchase Details
Closed on
Jun 4, 2008
Sold by
Felton Developing Inc
Bought by
Marchus Homes Inc
Create a Home Valuation Report for This Property
The Home Valuation Report is an in-depth analysis detailing your home's value as well as a comparison with similar homes in the area
Home Values in the Area
Average Home Value in this Area
Purchase History
| Date | Buyer | Sale Price | Title Company |
|---|---|---|---|
| Brew Nicholas | $600 | None Available | |
| Moszer Marissa | $199,900 | Nd Guaranty & Title Co | |
| Marchus Homes Inc | $57,200 | -- |
Source: Public Records
Mortgage History
| Date | Status | Borrower | Loan Amount |
|---|---|---|---|
| Open | Brew Nicholas | $220,150 | |
| Previous Owner | Moszer Marissa | $193,903 |
Source: Public Records
Tax History
| Year | Tax Paid | Tax Assessment Tax Assessment Total Assessment is a certain percentage of the fair market value that is determined by local assessors to be the total taxable value of land and additions on the property. | Land | Improvement |
|---|---|---|---|---|
| 2025 | $2,896 | $187,100 | $39,000 | $148,100 |
| 2024 | $4,048 | $178,150 | $36,000 | $142,150 |
| 2023 | $4,676 | $178,150 | $36,000 | $142,150 |
| 2022 | $4,131 | $161,800 | $36,000 | $125,800 |
| 2021 | $4,190 | $149,500 | $32,500 | $117,000 |
| 2020 | $4,291 | $159,050 | $32,500 | $126,550 |
| 2019 | $3,989 | $147,550 | $0 | $0 |
| 2018 | $3,749 | $147,550 | $29,000 | $118,550 |
| 2017 | $2,792 | $147,550 | $29,000 | $118,550 |
| 2016 | $2,792 | $147,550 | $22,000 | $125,550 |
| 2014 | -- | $122,950 | $0 | $0 |
Source: Public Records
Map
Nearby Homes
- 5524 Calvert Dr
- 5512 Calvert Dr
- 5511 Yukon Dr
- 5505 Yukon Dr
- 5506 Calvert Dr
- 5517 Yukon Dr
- 5530 Calvert Dr
- 5513 Calvert Dr
- 5519 Calvert Dr
- 5503 Yukon Dr
- 5507 Calvert Dr
- 5525 Calvert Dr
- 5523 Yukon Dr
- 5420 Calvert Dr
- 5501 Calvert Dr
- 5531 Calvert Dr
- 5501 Yukon Dr
- 5500 Yukon Dr
- 5414 Calvert Dr
- 5425 Calvert Dr
Your Personal Tour Guide
Ask me questions while you tour the home.