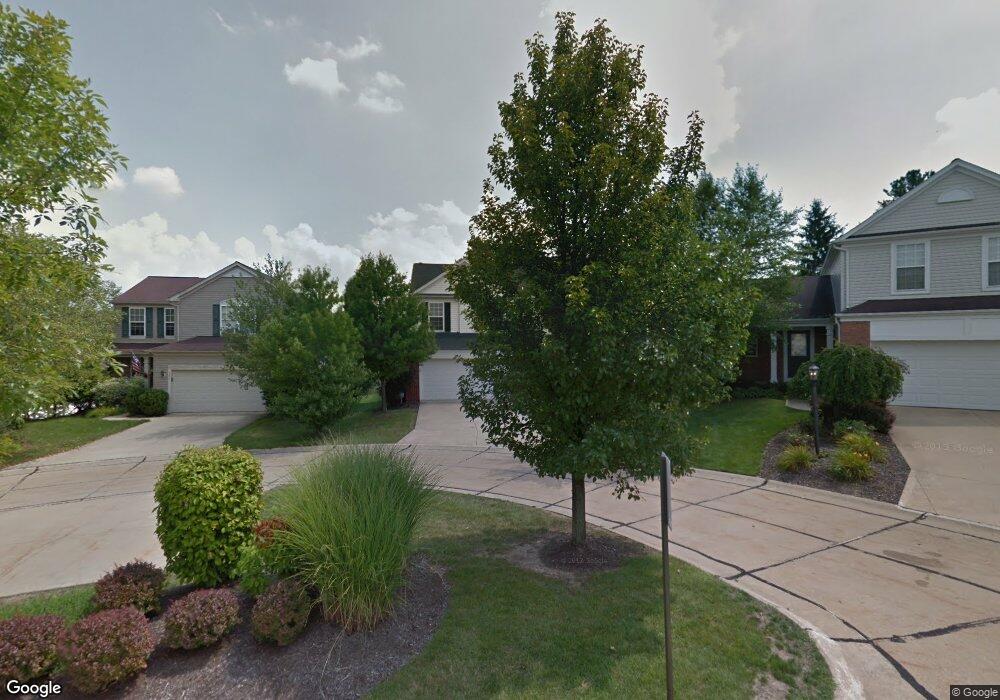
552 Canterbury Ln Northfield, OH 44067
Estimated Value: $352,337 - $425,000
4
Beds
3
Baths
2,234
Sq Ft
$171/Sq Ft
Est. Value
About This Home
This home is located at 552 Canterbury Ln, Northfield, OH 44067 and is currently estimated at $382,334, approximately $171 per square foot. 552 Canterbury Ln is a home located in Summit County with nearby schools including Lee Eaton Elementary School, Nordonia Middle School, and Nordonia High School.
Ownership History
Date
Name
Owned For
Owner Type
Purchase Details
Closed on
Jun 2, 2005
Sold by
Izer Robert M and Izer Nikki C
Bought by
Mckinnie Alisa and Lawson Mckinnie Alisa L
Current Estimated Value
Home Financials for this Owner
Home Financials are based on the most recent Mortgage that was taken out on this home.
Original Mortgage
$265,900
Outstanding Balance
$137,563
Interest Rate
5.62%
Mortgage Type
Fannie Mae Freddie Mac
Estimated Equity
$244,771
Purchase Details
Closed on
May 8, 2002
Sold by
Schraibman Chad
Bought by
Izer Robert M
Home Financials for this Owner
Home Financials are based on the most recent Mortgage that was taken out on this home.
Original Mortgage
$161,500
Interest Rate
5.5%
Purchase Details
Closed on
Oct 25, 1999
Sold by
Pulte Homes Of Ohio Corp
Bought by
Izer Robert M and Schraibman Chad C
Home Financials for this Owner
Home Financials are based on the most recent Mortgage that was taken out on this home.
Original Mortgage
$161,300
Interest Rate
6.99%
Create a Home Valuation Report for This Property
The Home Valuation Report is an in-depth analysis detailing your home's value as well as a comparison with similar homes in the area
Home Values in the Area
Average Home Value in this Area
Purchase History
| Date | Buyer | Sale Price | Title Company |
|---|---|---|---|
| Mckinnie Alisa | $265,900 | Revere Title Agency Inc | |
| Izer Robert M | -- | Endress/Lawyers Title | |
| Izer Robert M | $170,421 | Miller Examining Service Inc |
Source: Public Records
Mortgage History
| Date | Status | Borrower | Loan Amount |
|---|---|---|---|
| Open | Mckinnie Alisa | $265,900 | |
| Previous Owner | Izer Robert M | $161,500 | |
| Previous Owner | Izer Robert M | $161,300 |
Source: Public Records
Tax History Compared to Growth
Tax History
| Year | Tax Paid | Tax Assessment Tax Assessment Total Assessment is a certain percentage of the fair market value that is determined by local assessors to be the total taxable value of land and additions on the property. | Land | Improvement |
|---|---|---|---|---|
| 2025 | $5,031 | $99,953 | $18,221 | $81,732 |
| 2024 | $5,031 | $99,953 | $18,221 | $81,732 |
| 2023 | $5,031 | $99,953 | $18,221 | $81,732 |
| 2022 | $5,173 | $83,353 | $15,183 | $68,170 |
| 2021 | $5,069 | $83,353 | $15,183 | $68,170 |
| 2020 | $5,080 | $83,350 | $15,180 | $68,170 |
| 2019 | $5,209 | $78,320 | $14,420 | $63,900 |
| 2018 | $4,585 | $78,320 | $14,420 | $63,900 |
| 2017 | $4,395 | $78,320 | $14,420 | $63,900 |
| 2016 | $4,396 | $72,840 | $14,420 | $58,420 |
| 2015 | $4,395 | $72,840 | $14,420 | $58,420 |
| 2014 | $4,368 | $72,840 | $14,420 | $58,420 |
| 2013 | $4,719 | $79,450 | $14,420 | $65,030 |
Source: Public Records
Map
Nearby Homes
- 445 Houghton Rd
- 763 Willow Lake Dr
- 4930 Squire Dr
- 376 Bishop Way
- 8510 Waterside Dr
- 17221 Sagamore Rd
- 340 Pineo Ct
- 944 Heartridge Dr
- 247 Lowrie Blvd
- 18320 Fern Ln
- 133 Fell Ave
- 11768 Valley View Rd
- 395 Spring Pond Rd
- 10306 Electric Blvd
- 966 Nesbitt Rd
- 50 Kennedy Blvd
- 17001 Alexander Rd
- 8054 Sandstone Dr
- 81 Canter Ln Unit C
- V/L Meadow Ln
- 560 Canterbury Ln
- 544 Canterbury Ln
- 568 Canterbury Ln
- 528 Canterbury Ln
- 576 Canterbury Ln
- 520 Canterbury Ln
- 557 Canterbury Ln
- 573 Canterbury Ln
- 515 Canterbury Ln
- 584 Canterbury Ln
- 512 Canterbury Ln
- 8741 Eaton Dr
- 605 Canterbury Ln
- 592 Canterbury Ln
- 507 Canterbury Ln
- 8731 Eaton Dr
- 504 Canterbury Ln
- 613 Canterbury Ln
- 600 Canterbury Ln
- 467 Canterbury Ln