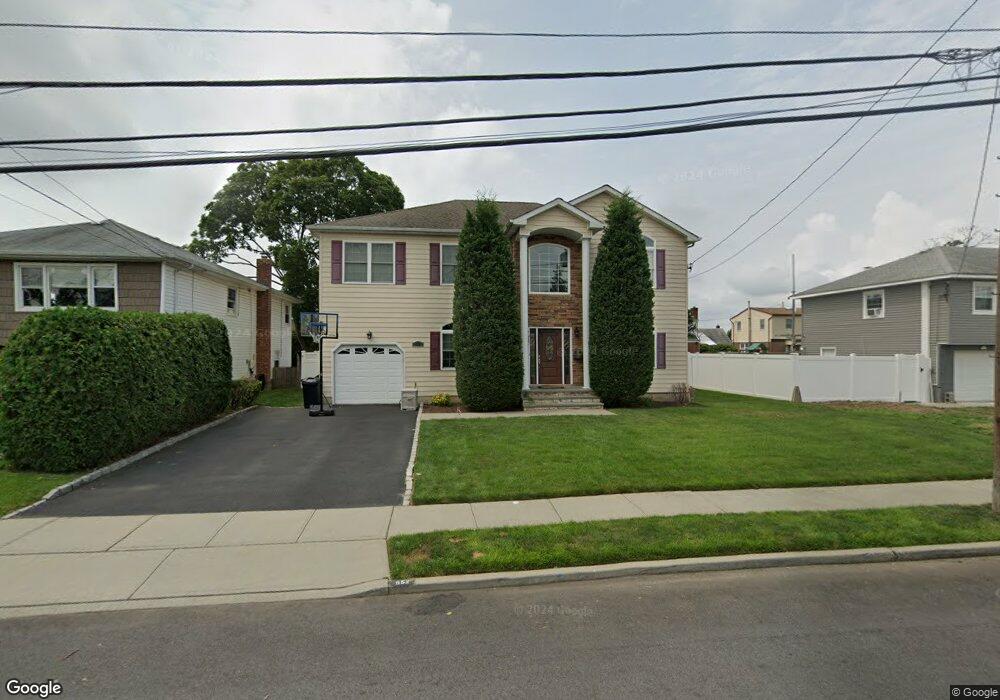
552 Chamberlin St East Meadow, NY 11554
Estimated Value: $1,139,000 - $1,221,003
4
Beds
3
Baths
2,721
Sq Ft
$434/Sq Ft
Est. Value
About This Home
This home is located at 552 Chamberlin St, East Meadow, NY 11554 and is currently estimated at $1,180,002, approximately $433 per square foot. 552 Chamberlin St is a home located in Nassau County with nearby schools including Woodland Middle School and Sacred Heart School.
Ownership History
Date
Name
Owned For
Owner Type
Purchase Details
Closed on
Mar 1, 2012
Sold by
Chamberlin Crest Developmnt Llc
Bought by
Woltmann Howard J and Woltmann Tina
Current Estimated Value
Home Financials for this Owner
Home Financials are based on the most recent Mortgage that was taken out on this home.
Original Mortgage
$345,000
Outstanding Balance
$237,490
Interest Rate
3.99%
Mortgage Type
New Conventional
Estimated Equity
$942,512
Purchase Details
Closed on
Feb 22, 2012
Sold by
Chamberlin Crest Development Llc
Bought by
Woltmann Howard J and Woltmann Tina
Home Financials for this Owner
Home Financials are based on the most recent Mortgage that was taken out on this home.
Original Mortgage
$345,000
Outstanding Balance
$237,490
Interest Rate
3.99%
Mortgage Type
New Conventional
Estimated Equity
$942,512
Purchase Details
Closed on
Sep 15, 2010
Sold by
Cafferty Elizabeth Ann and Of Elizabeth Macmillan
Bought by
Chamberlain Crest Development Llc
Create a Home Valuation Report for This Property
The Home Valuation Report is an in-depth analysis detailing your home's value as well as a comparison with similar homes in the area
Home Values in the Area
Average Home Value in this Area
Purchase History
| Date | Buyer | Sale Price | Title Company |
|---|---|---|---|
| Woltmann Howard J | -- | -- | |
| Woltmann Howard J | -- | -- | |
| Woltmann Howard J | -- | -- | |
| Woltmann Howard J | $645,000 | Not Available | |
| Woltmann Howard J | $645,000 | Not Available | |
| Chamberlain Crest Development Llc | $236,000 | -- | |
| Chamberlain Crest Development Llc | $236,000 | -- |
Source: Public Records
Mortgage History
| Date | Status | Borrower | Loan Amount |
|---|---|---|---|
| Open | Woltmann Howard J | $345,000 | |
| Closed | Woltmann Howard J | $345,000 | |
| Closed | Woltmann Howard J | $345,000 |
Source: Public Records
Tax History Compared to Growth
Tax History
| Year | Tax Paid | Tax Assessment Tax Assessment Total Assessment is a certain percentage of the fair market value that is determined by local assessors to be the total taxable value of land and additions on the property. | Land | Improvement |
|---|---|---|---|---|
| 2025 | $17,253 | $712 | $224 | $488 |
| 2024 | $5,566 | $760 | $239 | $521 |
| 2023 | $16,278 | $760 | $239 | $521 |
| 2022 | $16,278 | $760 | $239 | $521 |
| 2021 | $20,866 | $829 | $261 | $568 |
| 2020 | $17,314 | $928 | $569 | $359 |
| 2019 | $15,509 | $994 | $571 | $423 |
| 2018 | $14,646 | $1,061 | $0 | $0 |
| 2017 | $9,881 | $1,127 | $448 | $679 |
| 2016 | $15,126 | $1,193 | $474 | $719 |
| 2015 | $6,742 | $1,532 | $609 | $923 |
| 2014 | $6,742 | $1,532 | $609 | $923 |
| 2013 | $6,306 | $1,532 | $609 | $923 |
Source: Public Records
Map
Nearby Homes
- 508 Chamberlin St
- 503 Adelphi St
- 427 Benito St
- 1788 Noble St
- 378 Starke Ave
- 1701 Karen Ln
- 2013 Central Dr N
- 1459 Prospect Ave
- 1850 Lenox Ave
- 2405 Aberdeen St
- 734 Wenwood Dr
- 1963 Central Dr N
- 351 E Meadow Ave
- 311 Maple Ave
- 1963 Longfellow Ave
- 1434 Mark Dr
- 1918 Lenox Ave
- 265 Starke Ave
- 1748 Evergreen Ave
- 255 Maple Ave
- 554 Chamberlin St
- 540 Chamberlin St
- 545 Benito St
- 1663 Powers Ave
- 539 Benito St
- 1693 Powers Ave
- 539 Chamberlin St
- 528 Chamberlin St
- 533 Benito St
- 533 Chamberlin St
- 560 Chamberlin St
- 1701 Powers Ave
- 1662 Powers Ave
- 527 Benito St
- 527 Chamberlin St
- 522 Chamberlin St
- 1692 Powers Ave
- 1651 Powers Ave
- 540 Hull St
- 566 Chamberlin St