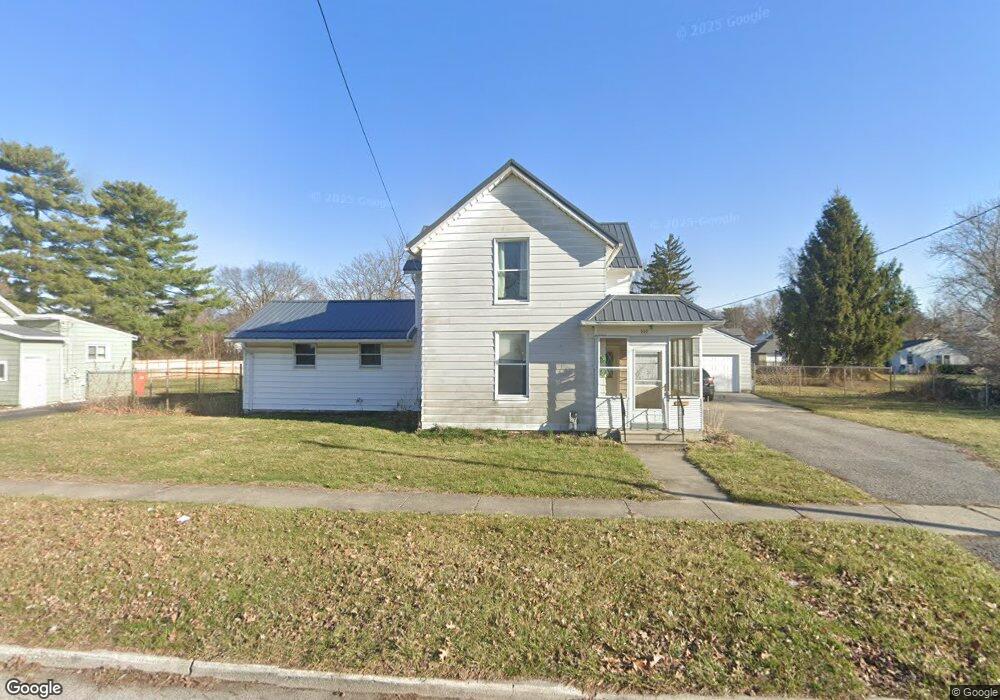
552 Clinton Ct Findlay, OH 45840
Estimated Value: $153,000 - $179,000
3
Beds
1
Bath
1,824
Sq Ft
$91/Sq Ft
Est. Value
About This Home
This home is located at 552 Clinton Ct, Findlay, OH 45840 and is currently estimated at $165,447, approximately $90 per square foot. 552 Clinton Ct is a home located in Hancock County with nearby schools including Whittier Elementary School, Wilson Vance Elementary School, and Donnell Middle School.
Ownership History
Date
Name
Owned For
Owner Type
Purchase Details
Closed on
Aug 18, 2011
Sold by
Deutsche Bank National Trust Company
Bought by
Uw Rentals Llc
Current Estimated Value
Purchase Details
Closed on
Nov 5, 2010
Sold by
Cramer Cynthia
Bought by
Deutsche Bank National Trust Company
Purchase Details
Closed on
Nov 4, 2005
Sold by
Taylor Kimela S and Chiow Robert D
Bought by
Cramer Cynthia
Home Financials for this Owner
Home Financials are based on the most recent Mortgage that was taken out on this home.
Original Mortgage
$20,000
Interest Rate
6.04%
Mortgage Type
Stand Alone Second
Purchase Details
Closed on
Feb 2, 2005
Sold by
Taylor Kimela S and Chiow Robert D
Bought by
Cramer Cindy
Home Financials for this Owner
Home Financials are based on the most recent Mortgage that was taken out on this home.
Original Mortgage
$70,000
Interest Rate
8.5%
Mortgage Type
Seller Take Back
Purchase Details
Closed on
Dec 16, 1983
Bought by
Teats Alyce M
Create a Home Valuation Report for This Property
The Home Valuation Report is an in-depth analysis detailing your home's value as well as a comparison with similar homes in the area
Home Values in the Area
Average Home Value in this Area
Purchase History
| Date | Buyer | Sale Price | Title Company |
|---|---|---|---|
| Uw Rentals Llc | $35,000 | Reliable Land Title Agency L | |
| Deutsche Bank National Trust Company | $33,334 | None Available | |
| Cramer Cynthia | $100,000 | Golden Key Title Agency | |
| Cramer Cindy | $76,000 | Assured Title Agency Inc | |
| Teats Alyce M | -- | -- |
Source: Public Records
Mortgage History
| Date | Status | Borrower | Loan Amount |
|---|---|---|---|
| Previous Owner | Cramer Cynthia | $20,000 | |
| Previous Owner | Cramer Cynthia | $80,000 | |
| Previous Owner | Cramer Cindy | $70,000 |
Source: Public Records
Map
Nearby Homes
- 523 Center St
- 655 Clinton Ct
- 640 Center St
- 439 Carnahan Ave
- 623 E Sandusky St
- 1020 Country Club Dr
- 810 Mcconnell St
- 213 Cherry St
- 125 Cherry St
- 741 Central Ave
- 1001 Decker Ave
- 309 Huron Rd
- 207 Ash Ave
- 1125 Glen Meadow Dr
- 1308 Greendale Ave
- 15591 Canadian Way
- 15586 Canadian Way
- 15615 Canadian Way
- 204 Laquineo St
- 1209 Heather Dr
Your Personal Tour Guide
Ask me questions while you tour the home.