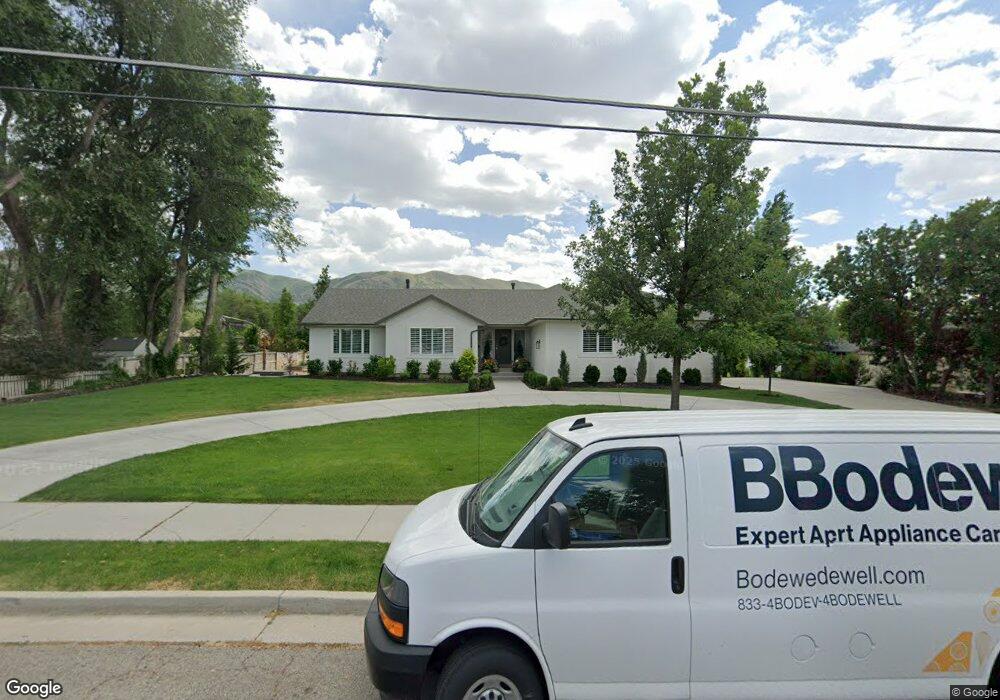
552 E Stokes Ave Draper, UT 84020
Estimated Value: $952,000 - $1,367,000
5
Beds
4
Baths
4,718
Sq Ft
$240/Sq Ft
Est. Value
About This Home
This home is located at 552 E Stokes Ave, Draper, UT 84020 and is currently estimated at $1,131,352, approximately $239 per square foot. 552 E Stokes Ave is a home located in Salt Lake County with nearby schools including Corner Canyon High School, Draper Park Middle School, and Channing Hall.
Ownership History
Date
Name
Owned For
Owner Type
Purchase Details
Closed on
Feb 6, 2020
Sold by
Huff Wilham Cooper and Elizabeth Huff Family Trust
Bought by
Knudsen Justin
Current Estimated Value
Home Financials for this Owner
Home Financials are based on the most recent Mortgage that was taken out on this home.
Original Mortgage
$480,000
Outstanding Balance
$420,737
Interest Rate
3.74%
Mortgage Type
New Conventional
Estimated Equity
$710,615
Purchase Details
Closed on
Nov 6, 2001
Sold by
Huff Clairon L and Huff Elizabeth C
Bought by
Huff Clairon L and Huff Elizabeth N
Purchase Details
Closed on
Mar 19, 1996
Sold by
Yohe Dale A
Bought by
Huff Clairon L and Huff Elizabeth C
Home Financials for this Owner
Home Financials are based on the most recent Mortgage that was taken out on this home.
Original Mortgage
$45,000
Interest Rate
6.55%
Purchase Details
Closed on
Feb 15, 1994
Sold by
Hunters Point Ltd Partnership
Bought by
Yohe Dale A
Create a Home Valuation Report for This Property
The Home Valuation Report is an in-depth analysis detailing your home's value as well as a comparison with similar homes in the area
Home Values in the Area
Average Home Value in this Area
Purchase History
| Date | Buyer | Sale Price | Title Company |
|---|---|---|---|
| Knudsen Justin | -- | Vanguard Title Union Park | |
| Huff Clairon L | -- | -- | |
| Huff Clairon L | -- | -- | |
| Yohe Dale A | -- | Associated Title Company |
Source: Public Records
Mortgage History
| Date | Status | Borrower | Loan Amount |
|---|---|---|---|
| Open | Knudsen Justin | $480,000 | |
| Previous Owner | Huff Clairon L | $45,000 |
Source: Public Records
Tax History
| Year | Tax Paid | Tax Assessment Tax Assessment Total Assessment is a certain percentage of the fair market value that is determined by local assessors to be the total taxable value of land and additions on the property. | Land | Improvement |
|---|---|---|---|---|
| 2025 | $4,493 | $911,800 | $300,000 | $611,800 |
| 2024 | $4,493 | $858,300 | $282,000 | $576,300 |
| 2023 | $4,092 | $776,000 | $248,200 | $527,800 |
| 2022 | $4,168 | $763,300 | $243,300 | $520,000 |
| 2021 | $4,207 | $658,200 | $197,900 | $460,300 |
| 2020 | $3,881 | $575,600 | $163,000 | $412,600 |
| 2019 | $3,661 | $530,600 | $163,000 | $367,600 |
| 2018 | $3,590 | $531,700 | $163,000 | $368,700 |
| 2017 | $3,491 | $495,400 | $146,700 | $348,700 |
| 2016 | $3,422 | $471,900 | $146,700 | $325,200 |
| 2015 | $3,343 | $426,800 | $142,900 | $283,900 |
| 2014 | $3,285 | $409,700 | $135,700 | $274,000 |
Source: Public Records
Map
Nearby Homes
- 13520 S Lone Rock Dr
- 528 E 13710 S
- 296 E Ireland Ln Unit 101
- 261 E Concord Farm Ln Unit 6
- 13898 Summerset Cir
- 248 E 13800 S Unit 27
- 13208 Sunset Glen Way
- 13888 S Wheadon Ct
- 265 E 13275 S
- 919 E 13800 S
- 13160 S 300 E
- 963 Old English Rd
- 13176 Day Ct
- 13554 Bella Monte Dr Unit 113
- 14119 S Senior Band Rd
- 13216 S Telemark Ln
- 12959 S Fort St
- 14283 S Wayfield Dr
- 645 E Rocky Mouth Ln
- 847 E Willow Springs Ln
- 552 Stokes Ave
- 570 E Stokes Ave
- 570 E Stokes Ave
- 532 Stokes Ave
- 527 E 13630 S
- 533 E 13630 S
- 533 E 13630 S Unit 22
- 600 Stokes Ave
- 673 E 13540 S
- 551 E Stokes Ave
- 551 Stokes Ave
- 551 Stokes Ave Unit 25 A
- 567 Stokes Ave
- 13583 S 500 E
- 533 Stokes Ave
- 604 E Stokes Ave
- 583 Stokes Ave
- 509 E 13630 S
- 511 Stokes Ave
- 511 Stokes Ave Unit 23 A
Your Personal Tour Guide
Ask me questions while you tour the home.