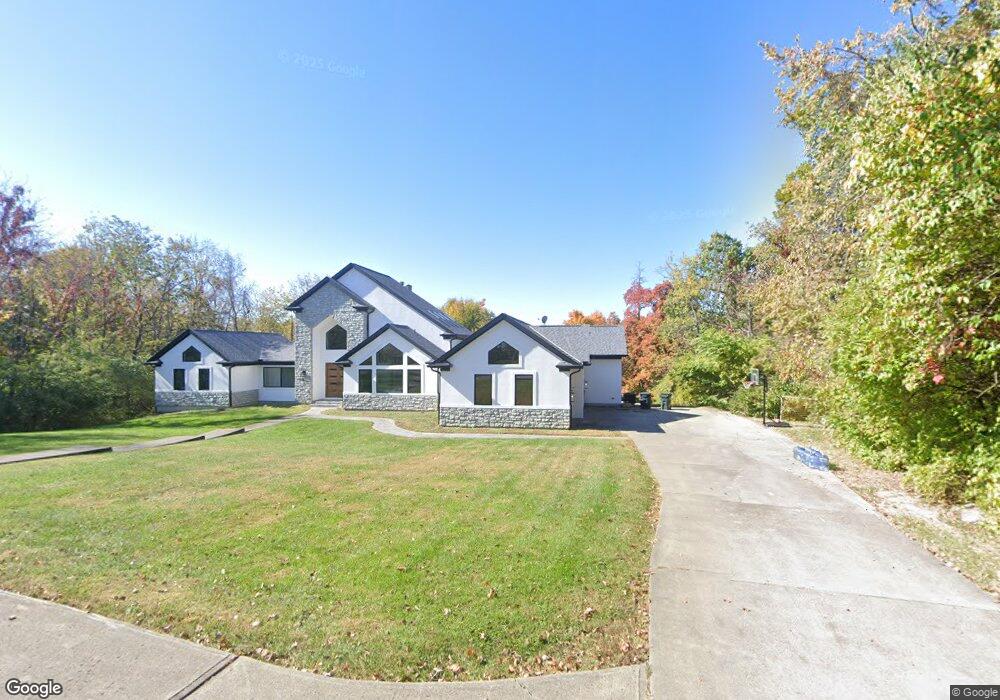
552 Locust Run Rd Cincinnati, OH 45245
Estimated Value: $1,107,412 - $1,605,000
5
Beds
6
Baths
6,986
Sq Ft
$194/Sq Ft
Est. Value
About This Home
This home is located at 552 Locust Run Rd, Cincinnati, OH 45245 and is currently estimated at $1,356,206, approximately $194 per square foot. 552 Locust Run Rd is a home located in Clermont County with nearby schools including Locust Corner Elementary School, New Richmond Middle School, and New Richmond High School.
Ownership History
Date
Name
Owned For
Owner Type
Purchase Details
Closed on
Jul 26, 2006
Sold by
Taylor Paul A
Bought by
Taylor Lori R
Current Estimated Value
Home Financials for this Owner
Home Financials are based on the most recent Mortgage that was taken out on this home.
Original Mortgage
$820,000
Outstanding Balance
$492,968
Interest Rate
6.88%
Mortgage Type
New Conventional
Estimated Equity
$863,238
Purchase Details
Closed on
May 21, 1996
Sold by
Locust Corner Land Co
Bought by
Taylor Paul A and Taylor Lori R
Home Financials for this Owner
Home Financials are based on the most recent Mortgage that was taken out on this home.
Original Mortgage
$150,000
Interest Rate
7.36%
Mortgage Type
New Conventional
Create a Home Valuation Report for This Property
The Home Valuation Report is an in-depth analysis detailing your home's value as well as a comparison with similar homes in the area
Purchase History
| Date | Buyer | Sale Price | Title Company |
|---|---|---|---|
| Taylor Lori R | -- | Royal Land Title Agency Ltd | |
| Taylor Paul A | $204,000 | -- |
Source: Public Records
Mortgage History
| Date | Status | Borrower | Loan Amount |
|---|---|---|---|
| Open | Taylor Lori R | $820,000 | |
| Closed | Taylor Paul A | $150,000 |
Source: Public Records
Tax History
| Year | Tax Paid | Tax Assessment Tax Assessment Total Assessment is a certain percentage of the fair market value that is determined by local assessors to be the total taxable value of land and additions on the property. | Land | Improvement |
|---|---|---|---|---|
| 2024 | $16,093 | $395,780 | $90,720 | $305,060 |
| 2023 | $16,090 | $395,780 | $90,720 | $305,060 |
| 2022 | $13,094 | $245,390 | $56,250 | $189,140 |
| 2021 | $12,264 | $245,390 | $56,250 | $189,140 |
| 2020 | $12,230 | $245,390 | $56,250 | $189,140 |
| 2019 | $9,615 | $216,660 | $56,110 | $160,550 |
| 2018 | $9,618 | $216,660 | $56,110 | $160,550 |
| 2017 | $10,073 | $216,660 | $56,110 | $160,550 |
| 2016 | $10,073 | $208,330 | $53,940 | $154,390 |
| 2015 | $9,264 | $208,330 | $53,940 | $154,390 |
| 2014 | $9,264 | $208,330 | $53,940 | $154,390 |
| 2013 | $9,203 | $205,420 | $61,250 | $144,170 |
Source: Public Records
Map
Nearby Homes
- 3703 Nine Mile Tobasco Rd
- 885 Southerness Dr
- 536 Hopper Hill Farms Rd
- 931 Winged Foot Way
- 3771 Hopper Hill Rd
- 551 Hal Cor Ln
- 553 Marions Way
- 854 Country Club Dr
- 0 Alpine Terrace Unit 1827302
- 8550 Old Kellogg Rd
- 6451 Braewing Ct
- 541 Davis Rd
- 0 Old Kellogg Rd
- 537 Davis Rd
- 8410 Old Kellogg Rd
- 595 Davis Rd
- 3826 Sturbridge Way
- 602 Legendary Ln
- 3775 Prestwick Cir
- 718 E Levitt Place
- 548 Locust Run Rd
- 553 Locust Run Rd
- A Locust Run Rd
- 0 Locust Run Rd Unit 2 902713
- 0 Locust Run Rd Unit 22
- 12 Locust Run Rd
- 22 Locust Run Rd Unit 22
- 8 Locust Run Rd Unit Lt8C
- 17 Locust Run Rd Unit 17A
- 20 Locust Run Rd Unit 20
- 13 Locust Run Rd Unit 13
- 3 Locust Run Rd Unit 3
- 12 Locust Run Rd Unit 12
- 19 Locust Run Rd Unit 19
- 18 Locust Run Rd Unit 18
- 21 Locust Run Rd Unit 21
- 4 Locust Run Rd Unit 4
- 11 Locust Run Rd Unit 11
- 16 Locust Run Rd Unit 16
- 5 Locust Run Rd Unit 5
Your Personal Tour Guide
Ask me questions while you tour the home.