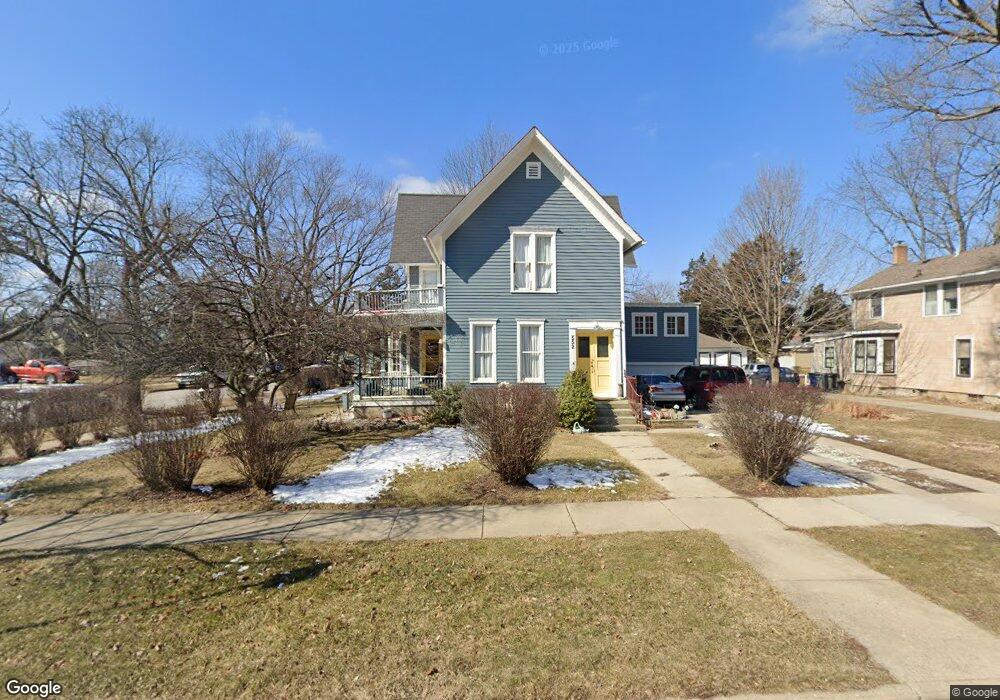
552 N Spring St Elgin, IL 60120
Northeast Elgin NeighborhoodEstimated Value: $336,688 - $404,000
4
Beds
2
Baths
2,800
Sq Ft
$130/Sq Ft
Est. Value
About This Home
This home is located at 552 N Spring St, Elgin, IL 60120 and is currently estimated at $365,172, approximately $130 per square foot. 552 N Spring St is a home located in Kane County with nearby schools including McKinley Elementary School, Larsen Middle School, and Elgin High School.
Ownership History
Date
Name
Owned For
Owner Type
Purchase Details
Closed on
Aug 4, 2020
Sold by
Kuwamoto Nancie L
Bought by
Miller Kuwamoto Nancie L and Miller Kuwamoto Nancie
Current Estimated Value
Home Financials for this Owner
Home Financials are based on the most recent Mortgage that was taken out on this home.
Original Mortgage
$148,000
Outstanding Balance
$135,912
Interest Rate
5.12%
Mortgage Type
New Conventional
Estimated Equity
$229,260
Purchase Details
Closed on
Mar 12, 2001
Sold by
The Bank Of New York
Bought by
Kuwamoto Nancie L
Home Financials for this Owner
Home Financials are based on the most recent Mortgage that was taken out on this home.
Original Mortgage
$100,000
Interest Rate
9.35%
Purchase Details
Closed on
Dec 12, 2000
Sold by
Smeltzer William D and Smeltzer Gale M
Bought by
First City Capital Home Equity Loan Trus
Create a Home Valuation Report for This Property
The Home Valuation Report is an in-depth analysis detailing your home's value as well as a comparison with similar homes in the area
Home Values in the Area
Average Home Value in this Area
Purchase History
| Date | Buyer | Sale Price | Title Company |
|---|---|---|---|
| Miller Kuwamoto Nancie L | -- | Accommodation | |
| Kuwamoto Nancie L | $125,000 | First American Title Ins Co | |
| First City Capital Home Equity Loan Trus | -- | First American Title Ins Co |
Source: Public Records
Mortgage History
| Date | Status | Borrower | Loan Amount |
|---|---|---|---|
| Open | Miller Kuwamoto Nancie L | $148,000 | |
| Closed | Kuwamoto Nancie L | $100,000 |
Source: Public Records
Tax History
| Year | Tax Paid | Tax Assessment Tax Assessment Total Assessment is a certain percentage of the fair market value that is determined by local assessors to be the total taxable value of land and additions on the property. | Land | Improvement |
|---|---|---|---|---|
| 2024 | $6,414 | $88,151 | $18,486 | $69,665 |
| 2023 | $6,107 | $79,638 | $16,701 | $62,937 |
| 2022 | $5,776 | $72,616 | $15,228 | $57,388 |
| 2021 | $5,522 | $67,891 | $14,237 | $53,654 |
| 2020 | $5,141 | $62,373 | $13,591 | $48,782 |
| 2019 | $4,989 | $59,414 | $12,946 | $46,468 |
| 2018 | $4,834 | $54,896 | $12,196 | $42,700 |
| 2017 | $4,721 | $51,897 | $11,530 | $40,367 |
| 2016 | $4,495 | $48,147 | $10,697 | $37,450 |
| 2015 | -- | $44,131 | $9,805 | $34,326 |
| 2014 | -- | $43,586 | $9,684 | $33,902 |
| 2013 | -- | $50,876 | $9,939 | $40,937 |
Source: Public Records
Map
Nearby Homes
- 603 Douglas Ave
- 464 Prospect St
- 841 Douglas Ave
- 851 N Grove Ave
- 409 Algona Ave
- 268 N Gifford St
- 920 Augusta Ave
- 131 N Gifford St
- 453 Addison St
- LOT 17 Teal Ave
- LOTS 14 & 15 Teal Ave
- 9 N Jackson St
- 216 Prairie St
- 336 Hamilton Ave
- 601 Columbia Ave
- 211 Prairie St
- 705 W Highland Ave
- 115 N Porter St
- 96 S Crystal St
- 162 Festival Ct
- 560 N Spring St
- 164 Plum St
- 520 N Spring St
- 564 N Spring St
- 163 Jefferson Ave
- 514 N Spring St
- 570 N Spring St
- 555 N Spring St
- 561 Douglas Ave
- 559 N Spring St
- 519 N Spring St
- 565 Douglas Ave
- 519 Douglas Ave Unit 521
- 565 N Spring St
- 508 N Spring St
- 515 N Spring St
- 571 Douglas Ave
- 515 Douglas Ave
- 573 N Spring St
- 214 Plum St
Your Personal Tour Guide
Ask me questions while you tour the home.