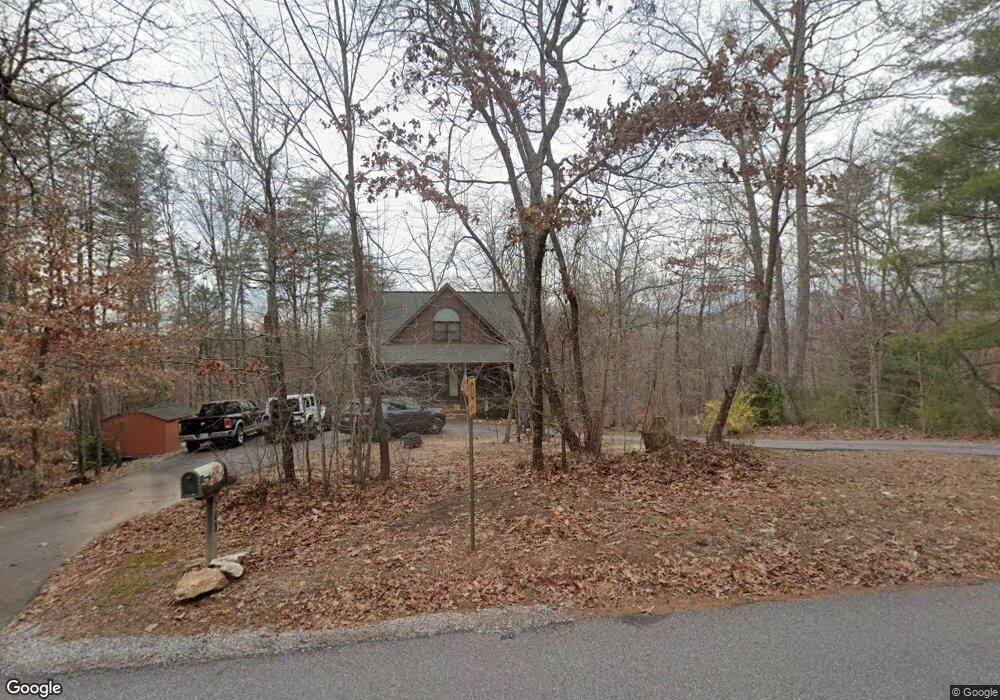
552 River Flow Dr Unit 17 Dahlonega, GA 30533
Estimated Value: $320,914 - $355,000
2
Beds
2
Baths
1,276
Sq Ft
$270/Sq Ft
Est. Value
About This Home
This home is located at 552 River Flow Dr Unit 17, Dahlonega, GA 30533 and is currently estimated at $343,979, approximately $269 per square foot. 552 River Flow Dr Unit 17 is a home located in Lumpkin County with nearby schools including Lumpkin County High School.
Ownership History
Date
Name
Owned For
Owner Type
Purchase Details
Closed on
May 17, 2023
Sold by
Astin Pamela Hulsey
Bought by
Joseph Cleveland Hulsey Rev Liv Tr
Current Estimated Value
Purchase Details
Closed on
Apr 25, 2023
Sold by
Hulsey Joseph C
Bought by
Astin Pamela Hulsey and Hulsey Joseph Christopher
Purchase Details
Closed on
Feb 25, 2020
Sold by
Brightman Gary J
Bought by
Hulsey Joseph C and Hulsey Cheryl S
Purchase Details
Closed on
Nov 23, 2015
Sold by
Szereto Mitzi
Bought by
Brightman Gary J and Brightman Dierdre
Purchase Details
Closed on
May 15, 2013
Sold by
Hayes Ricky
Bought by
Szereto Mitzi
Purchase Details
Closed on
Jan 25, 2013
Sold by
First Citizens Bank Of Georgia
Bought by
Hayes Greg and Hayes Ricky
Purchase Details
Closed on
Dec 6, 2011
Sold by
Dowis Vicotr and Dowis Dale
Bought by
First Citizens Bank Of Georgia
Purchase Details
Closed on
Mar 30, 2006
Sold by
Noblin Nancy
Bought by
Hayes Greg and Hayes Ricky
Create a Home Valuation Report for This Property
The Home Valuation Report is an in-depth analysis detailing your home's value as well as a comparison with similar homes in the area
Home Values in the Area
Average Home Value in this Area
Purchase History
| Date | Buyer | Sale Price | Title Company |
|---|---|---|---|
| Joseph Cleveland Hulsey Rev Liv Tr | -- | -- | |
| Astin Pamela Hulsey | -- | -- | |
| Hulsey Joseph C | $200,000 | -- | |
| Brightman Gary J | $167,000 | -- | |
| Szereto Mitzi | $152,000 | -- | |
| Hayes Greg | -- | -- | |
| First Citizens Bank Of Georgia | -- | -- | |
| Hayes Greg | $389,500 | -- |
Source: Public Records
Tax History Compared to Growth
Tax History
| Year | Tax Paid | Tax Assessment Tax Assessment Total Assessment is a certain percentage of the fair market value that is determined by local assessors to be the total taxable value of land and additions on the property. | Land | Improvement |
|---|---|---|---|---|
| 2024 | $2,416 | $101,966 | $13,968 | $87,998 |
| 2023 | $2,252 | $95,757 | $13,968 | $81,789 |
| 2022 | $233 | $91,177 | $13,968 | $77,209 |
| 2021 | $91 | $77,022 | $13,968 | $63,054 |
| 2020 | $73 | $75,138 | $13,968 | $61,170 |
| 2019 | $44 | $72,226 | $13,968 | $58,258 |
| 2018 | $1,845 | $65,021 | $13,968 | $51,053 |
| 2017 | $0 | $61,155 | $13,968 | $47,187 |
| 2016 | $1,635 | $56,681 | $13,968 | $42,713 |
| 2015 | $1,506 | $56,681 | $13,968 | $42,713 |
| 2014 | $1,506 | $57,116 | $13,968 | $43,148 |
| 2013 | -- | $13,968 | $13,968 | $0 |
Source: Public Records
Map
Nearby Homes
- 190 Grand Oak Ln
- 221 Laurel Cir
- 15 Baker St
- 0 Rainmore Dr Unit 7620063
- 0 Rainmore Dr Unit 10570615
- 486 Laurel Cir
- 103 Rainmore Dr
- 191 Sleepy Hollow Rd
- 150 Buck Run E
- 194 Deerfield Dr
- 33 Tj Mote Rd
- 33 T J Mote Rd
- 50 Loyal Dr
- 775 Crooked Creek Dr
- 0 Honey Tree Terrace Unit 10448792
- 0 Honey Tree Terrace Unit 7516071
- 251 Bearslide Hollow
- Lot 5 Still Rd
- 1044 Rider Rd
- 239 Castleberry Ln
- 552 River Flow Dr Unit 171
- 552 River Flow Dr
- 508 River Flow Dr
- 508 River Flow Dr Unit 16
- 476 River Flow Dr
- 594 River Flow Dr
- 505 River Flow Dr
- 630 River Flow Dr
- 230 Misty Hollow Dr
- 255 Misty Hollow Dr
- 445 River Flow Dr
- 555 River Flow Dr Unit 9
- 555 River Flow Dr
- 259 Misty Hollow Dr Unit 21
- 259 Misty Hollow Dr
- 15 Maple Ridge Rd
- 261 Promise Trail
- 161 Maple Ridge Rd
- 686 River Flow Dr
- N Promise Trail