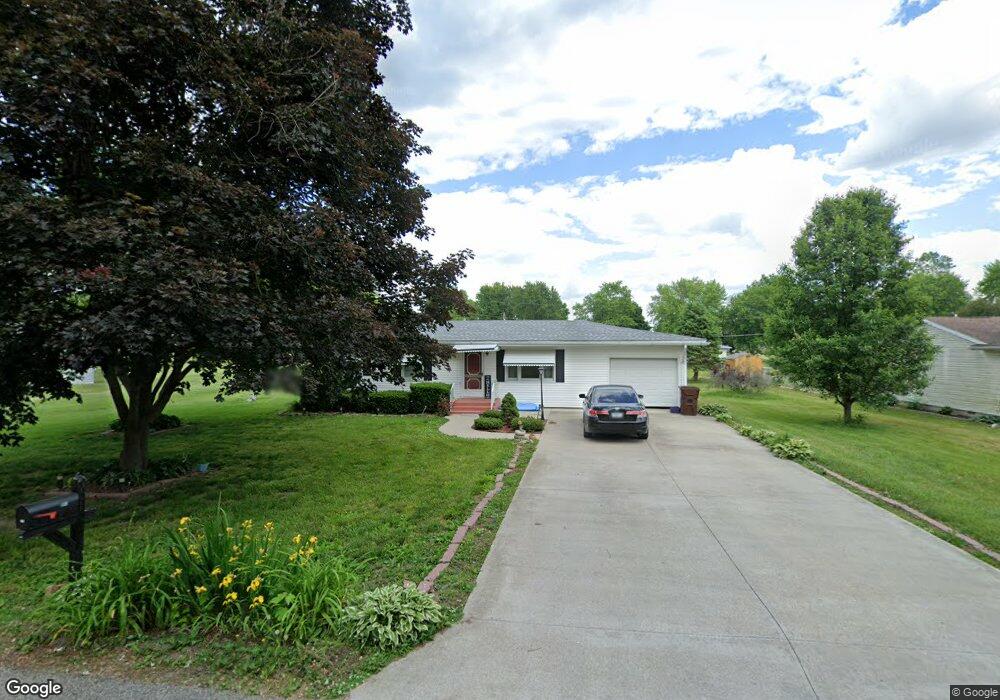
552 S Fulton St Clinton, IN 47842
Estimated Value: $141,000 - $179,000
--
Bed
1
Bath
1,210
Sq Ft
$127/Sq Ft
Est. Value
About This Home
This home is located at 552 S Fulton St, Clinton, IN 47842 and is currently estimated at $153,197, approximately $126 per square foot. 552 S Fulton St is a home located in Vermillion County with nearby schools including South Vermillion High School and Sacred Heart School.
Ownership History
Date
Name
Owned For
Owner Type
Purchase Details
Closed on
Jul 17, 2023
Sold by
Drake Timothy Jon Everett
Bought by
Drake Era J
Current Estimated Value
Home Financials for this Owner
Home Financials are based on the most recent Mortgage that was taken out on this home.
Original Mortgage
$80,000
Outstanding Balance
$78,063
Interest Rate
6.71%
Mortgage Type
New Conventional
Estimated Equity
$75,134
Purchase Details
Closed on
Dec 5, 2022
Sold by
Drake Linda K
Bought by
Drake Timothy Jon Everett
Purchase Details
Closed on
Jul 16, 2018
Sold by
Cox Beryl J
Bought by
Pinegar Linda K
Purchase Details
Closed on
Mar 29, 2010
Sold by
Mckinley Kenneth J
Bought by
Cox Harold R and Cox Beryl J
Create a Home Valuation Report for This Property
The Home Valuation Report is an in-depth analysis detailing your home's value as well as a comparison with similar homes in the area
Home Values in the Area
Average Home Value in this Area
Purchase History
| Date | Buyer | Sale Price | Title Company |
|---|---|---|---|
| Drake Era J | $105,000 | Integrity Title | |
| Drake Timothy Jon Everett | -- | None Listed On Document | |
| Pinegar Linda K | -- | None Available | |
| Cox Harold R | $63,000 | Antonini & Antonini | |
| Cox Harold R | $63,000 | -- | |
| Harold Harold R | $63,000 | Antonini & Antonini | |
| Cox Harold R | $63,000 | -- |
Source: Public Records
Mortgage History
| Date | Status | Borrower | Loan Amount |
|---|---|---|---|
| Open | Drake Era J | $80,000 |
Source: Public Records
Tax History Compared to Growth
Tax History
| Year | Tax Paid | Tax Assessment Tax Assessment Total Assessment is a certain percentage of the fair market value that is determined by local assessors to be the total taxable value of land and additions on the property. | Land | Improvement |
|---|---|---|---|---|
| 2024 | $918 | $104,000 | $34,800 | $69,200 |
| 2023 | $962 | $104,000 | $34,800 | $69,200 |
| 2022 | $1,785 | $84,500 | $16,700 | $67,800 |
| 2021 | $1,620 | $75,500 | $16,700 | $58,800 |
| 2020 | $1,602 | $74,700 | $21,200 | $53,500 |
| 2019 | $1,634 | $76,300 | $21,200 | $55,100 |
| 2018 | $0 | $72,000 | $10,700 | $61,300 |
| 2017 | $0 | $68,200 | $10,700 | $57,500 |
| 2016 | -- | $68,500 | $10,700 | $57,800 |
| 2014 | -- | $61,900 | $10,700 | $51,200 |
| 2013 | -- | $61,900 | $10,700 | $51,200 |
Source: Public Records
Map
Nearby Homes
- 539 S Lincoln St
- 736 S Fulton St
- 548 E 7th St
- 775 S Lincoln St
- 312 S Fulton St
- 1245 N 11th St
- 1162 W Ewing St
- 1108 W Ewing St
- 1102 Matthews St
- 162 N Gilbert St
- 368 S Jackson St
- 1219 W 2nd St
- 945 Morey St
- 821 N 8th St
- 15034 S Willow Grove Ave
- 1095 Oakridge Dr
- 522 N Main St
- 200 E Clinton Ct
- 359 N 3rd St
- 1059 Blackman St
- 530 S Fulton St
- 565 S Fulton St
- 558 S Fulton St
- 557 S Fulton St
- 543 S Fulton St
- 572 S Fulton St
- 525 S Davis St
- 561 S Davis St
- 533 S Fulton St
- 575 S Fulton St
- 575 S Davis St
- 823 E 5th St
- 540 S Gilbert St
- 631 S Fulton St
- 469 S Fulton St
- 734 E 5th St
- 878 E 6th St
- 466 S Fulton St
- 550 S Davis St
- 556 S Gilbert St