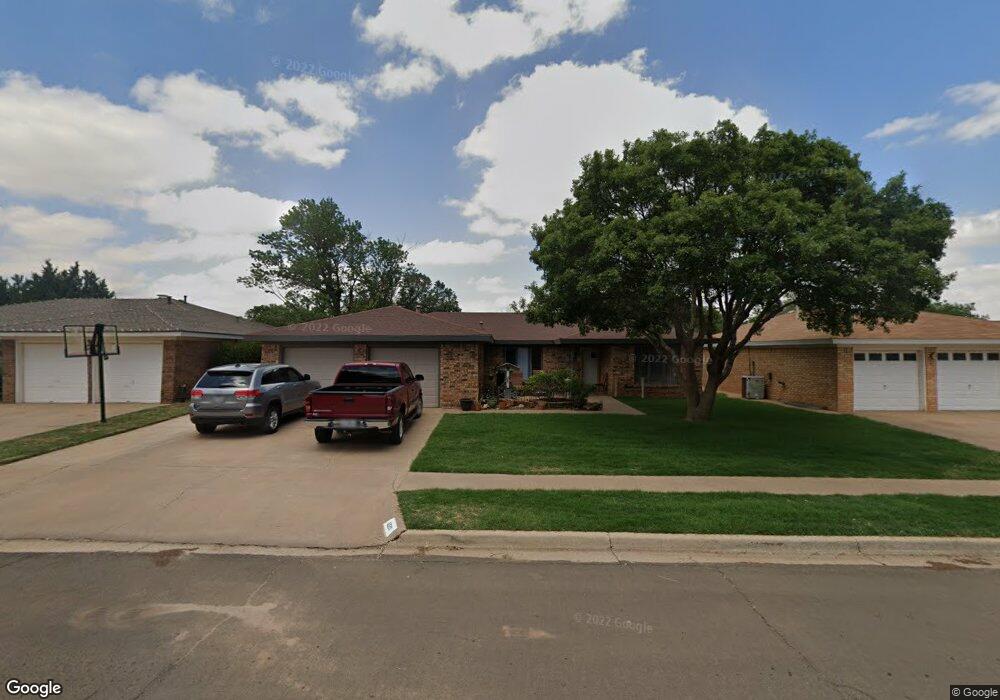
5520 90th St Lubbock, TX 79424
Preston Smith NeighborhoodEstimated Value: $219,000 - $230,000
3
Beds
2
Baths
1,672
Sq Ft
$135/Sq Ft
Est. Value
About This Home
This home is located at 5520 90th St, Lubbock, TX 79424 and is currently estimated at $225,085, approximately $134 per square foot. 5520 90th St is a home located in Lubbock County with nearby schools including Smith Elementary School, Irons Middle School, and Coronado High School.
Ownership History
Date
Name
Owned For
Owner Type
Purchase Details
Closed on
Mar 11, 2021
Sold by
Qualls Daniel
Bought by
Qualls Jerry W
Current Estimated Value
Purchase Details
Closed on
Sep 5, 2014
Sold by
Kilgore David and Kilgore Norma
Bought by
Qualls Debra S and Qualls Jerry W
Purchase Details
Closed on
Jun 26, 1996
Sold by
Pierce Tanya Kay
Bought by
Qualls Jerry W and Qualls Debra S
Purchase Details
Closed on
Jun 15, 1995
Sold by
Pooley Richard W
Bought by
Qualls Jerry W and Qualls Debra S
Purchase Details
Closed on
May 15, 1995
Sold by
Northrup Tanya Kay
Bought by
Qualls Jerry W and Qualls Debra S
Create a Home Valuation Report for This Property
The Home Valuation Report is an in-depth analysis detailing your home's value as well as a comparison with similar homes in the area
Home Values in the Area
Average Home Value in this Area
Purchase History
| Date | Buyer | Sale Price | Title Company |
|---|---|---|---|
| Qualls Jerry W | -- | None Available | |
| Qualls Debra S | -- | Service Title | |
| Qualls Jerry W | -- | -- | |
| Qualls Jerry W | -- | -- | |
| Qualls Jerry W | -- | -- |
Source: Public Records
Tax History
| Year | Tax Paid | Tax Assessment Tax Assessment Total Assessment is a certain percentage of the fair market value that is determined by local assessors to be the total taxable value of land and additions on the property. | Land | Improvement |
|---|---|---|---|---|
| 2025 | $3,032 | $234,354 | $18,525 | $215,829 |
| 2024 | $39 | $224,641 | $18,525 | $206,116 |
| 2023 | $3,667 | $197,275 | $18,525 | $178,750 |
| 2022 | $3,630 | $179,341 | $18,525 | $178,059 |
| 2021 | $3,492 | $163,037 | $18,525 | $144,512 |
| 2020 | $3,443 | $158,345 | $18,525 | $139,820 |
| 2019 | $3,555 | $158,345 | $18,525 | $139,820 |
| 2018 | $3,243 | $144,269 | $18,525 | $125,744 |
| 2017 | $3,247 | $144,269 | $18,525 | $125,744 |
| 2016 | $3,142 | $139,577 | $18,525 | $121,052 |
| 2015 | $2,522 | $128,417 | $9,750 | $118,667 |
| 2014 | $2,522 | $121,743 | $9,750 | $111,993 |
Source: Public Records
Map
Nearby Homes
Your Personal Tour Guide
Ask me questions while you tour the home.