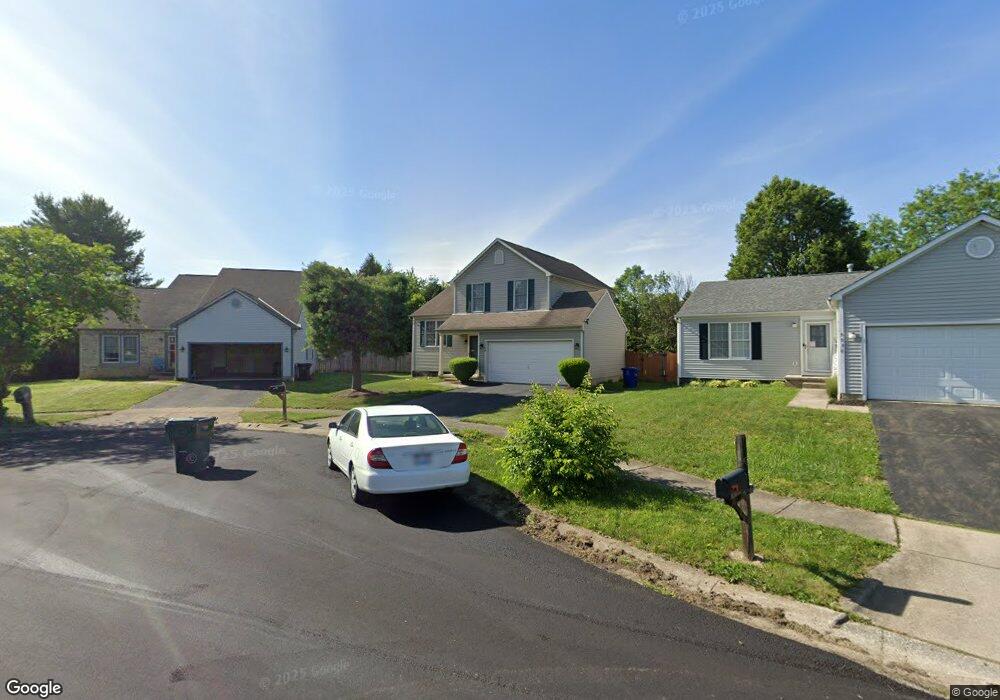
5522 Labrador Ln Columbus, OH 43232
Walnut Heights NeighborhoodEstimated Value: $245,000 - $276,000
3
Beds
3
Baths
1,404
Sq Ft
$184/Sq Ft
Est. Value
About This Home
This home is located at 5522 Labrador Ln, Columbus, OH 43232 and is currently estimated at $258,473, approximately $184 per square foot. 5522 Labrador Ln is a home located in Franklin County with nearby schools including Liberty Elementary School, Yorktown Middle School, and Independence High School.
Ownership History
Date
Name
Owned For
Owner Type
Purchase Details
Closed on
Sep 9, 2024
Sold by
Fountain Rochelle and Jones Rochelle
Bought by
Jones Rochelle and Jones Kyra
Current Estimated Value
Purchase Details
Closed on
Apr 6, 2007
Sold by
Waters Kenneth I and Waters Terri E
Bought by
Fountain Rochelle
Home Financials for this Owner
Home Financials are based on the most recent Mortgage that was taken out on this home.
Original Mortgage
$106,100
Interest Rate
6.2%
Mortgage Type
Purchase Money Mortgage
Purchase Details
Closed on
Feb 8, 1999
Sold by
Dominion Homes Inc
Bought by
Waters Kenneth I and Waters Terri E
Home Financials for this Owner
Home Financials are based on the most recent Mortgage that was taken out on this home.
Original Mortgage
$126,074
Interest Rate
6.81%
Mortgage Type
FHA
Create a Home Valuation Report for This Property
The Home Valuation Report is an in-depth analysis detailing your home's value as well as a comparison with similar homes in the area
Home Values in the Area
Average Home Value in this Area
Purchase History
| Date | Buyer | Sale Price | Title Company |
|---|---|---|---|
| Jones Rochelle | -- | None Listed On Document | |
| Fountain Rochelle | $113,000 | Talon Group | |
| Waters Kenneth I | $130,500 | Alliance Title |
Source: Public Records
Mortgage History
| Date | Status | Borrower | Loan Amount |
|---|---|---|---|
| Previous Owner | Fountain Rochelle | $106,100 | |
| Previous Owner | Waters Kenneth I | $126,074 |
Source: Public Records
Tax History Compared to Growth
Tax History
| Year | Tax Paid | Tax Assessment Tax Assessment Total Assessment is a certain percentage of the fair market value that is determined by local assessors to be the total taxable value of land and additions on the property. | Land | Improvement |
|---|---|---|---|---|
| 2024 | $3,337 | $74,350 | $23,280 | $51,070 |
| 2023 | $3,294 | $74,340 | $23,275 | $51,065 |
| 2022 | $2,293 | $44,210 | $6,300 | $37,910 |
| 2021 | $2,297 | $44,210 | $6,300 | $37,910 |
| 2020 | $2,300 | $44,210 | $6,300 | $37,910 |
| 2019 | $2,208 | $36,400 | $5,250 | $31,150 |
| 2018 | $2,143 | $36,400 | $5,250 | $31,150 |
| 2017 | $2,250 | $36,400 | $5,250 | $31,150 |
| 2016 | $2,293 | $34,620 | $4,380 | $30,240 |
| 2015 | $2,082 | $34,620 | $4,380 | $30,240 |
| 2014 | $2,087 | $34,620 | $4,380 | $30,240 |
| 2013 | $1,212 | $40,740 | $5,145 | $35,595 |
Source: Public Records
Map
Nearby Homes
- 3000 Whitlow Rd
- 5373 Spire Ln
- 5401 Spire Ln
- 2998 Osgood Rd E
- 3387 Retriever Rd
- 5397 Jack Russell Way
- 5125 Upton Rd N
- 3289 Kady Ln
- 5377 Bleaker Ave
- 3246 Latonia Rd
- 3148 Aldgate St
- 3198 Gallant Dr
- 2901 Renfro Rd
- 4974 Silverton Dr
- 5278 Glenbriar Ct
- 5137 Holbrook Dr
- 5152 Burdett Dr
- 5882 Abernathy Ln Unit 5882F
- 2900 Ronda Rd
- 5522 Newport Ct
- 5530 Labrador Ln
- 3141 St Bernard Cir
- 3141 Saint Bernard Cir
- 5538 Labrador Ln
- 3149 Saint Bernard Cir
- 3149 St Bernard Cir
- 5546 Labrador Ln
- 3157 Saint Bernard Cir
- 3158 Saint Bernard Cir
- 3134 Fontaine Rd
- 3126 Fontaine Rd
- 3140 Fontaine Rd
- 5425 Argo Ln
- 5433 Argo Ln
- 5554 Labrador Ln
- 3165 Saint Bernard Cir
- 3104 Reynard Rd
- 3148 Fontaine Rd
- 3166 Saint Bernard Cir
- 3166 St Bernard Cir