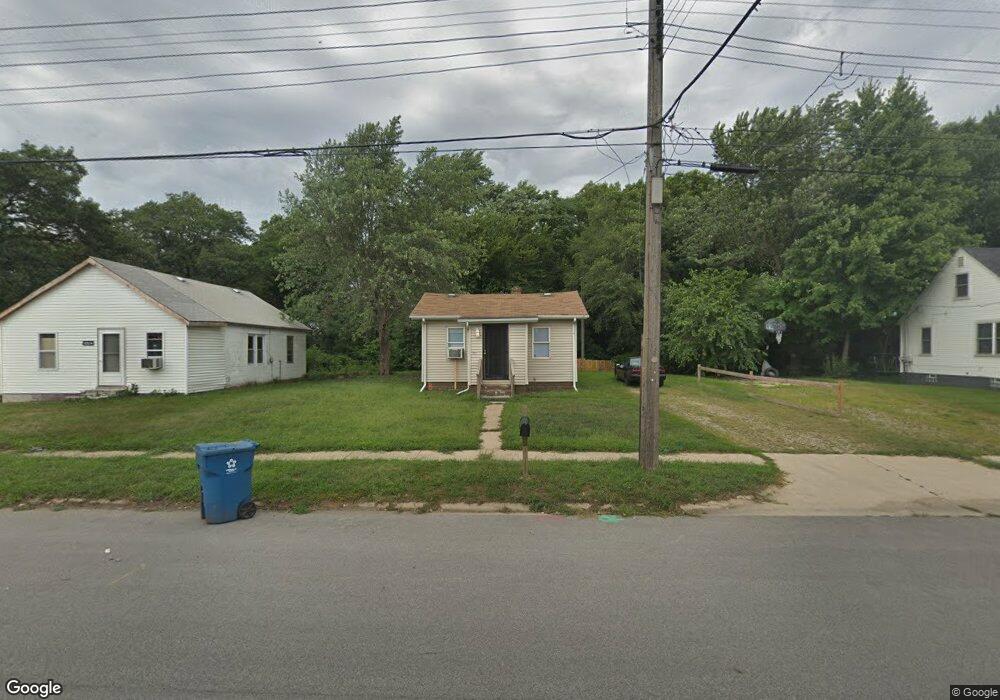
5522 W 9th Ave Gary, IN 46406
Westside NeighborhoodEstimated Value: $77,000 - $118,000
2
Beds
1
Bath
840
Sq Ft
$115/Sq Ft
Est. Value
About This Home
This home is located at 5522 W 9th Ave, Gary, IN 46406 and is currently estimated at $96,265, approximately $114 per square foot. 5522 W 9th Ave is a home located in Lake County with nearby schools including Bailly Preparatory Academy, West Side Leadership Academy, and Aspire Charter Academy.
Ownership History
Date
Name
Owned For
Owner Type
Purchase Details
Closed on
Jun 18, 2021
Sold by
Drew Willie Mae
Bought by
Mj Drew Properties Llc
Current Estimated Value
Purchase Details
Closed on
Dec 7, 2012
Sold by
Stonecrest Income & Opportunity Fund I L
Bought by
Drew Willie Mae
Purchase Details
Closed on
Feb 18, 2011
Sold by
Wells Fargo Bank Na
Bought by
Stonecrest Income & Opportunity Fund 1 L
Purchase Details
Closed on
Dec 17, 2008
Sold by
Residential Funding Company Llc
Bought by
Wells Fargo Bank Na
Purchase Details
Closed on
May 2, 2008
Sold by
Johnson James A
Bought by
Residential Funding Co Llc
Purchase Details
Closed on
Oct 2, 2006
Sold by
Clark James P and Clark Tameka L
Bought by
Johnson James A
Home Financials for this Owner
Home Financials are based on the most recent Mortgage that was taken out on this home.
Original Mortgage
$64,600
Interest Rate
10.62%
Mortgage Type
Purchase Money Mortgage
Create a Home Valuation Report for This Property
The Home Valuation Report is an in-depth analysis detailing your home's value as well as a comparison with similar homes in the area
Home Values in the Area
Average Home Value in this Area
Purchase History
| Date | Buyer | Sale Price | Title Company |
|---|---|---|---|
| Mj Drew Properties Llc | -- | None Available | |
| Drew Willie Mae | $1,100 | None Available | |
| Stonecrest Income & Opportunity Fund 1 L | $500 | Resource Title National Agen | |
| Wells Fargo Bank Na | -- | None Available | |
| Residential Funding Co Llc | $61,600 | None Available | |
| Johnson James A | -- | Plm Title |
Source: Public Records
Mortgage History
| Date | Status | Borrower | Loan Amount |
|---|---|---|---|
| Previous Owner | Johnson James A | $64,600 |
Source: Public Records
Tax History
| Year | Tax Paid | Tax Assessment Tax Assessment Total Assessment is a certain percentage of the fair market value that is determined by local assessors to be the total taxable value of land and additions on the property. | Land | Improvement |
|---|---|---|---|---|
| 2025 | $1,302 | $56,700 | $7,600 | $49,100 |
| 2024 | $4,232 | $51,900 | $8,500 | $43,400 |
| 2023 | $1,125 | $48,000 | $8,500 | $39,500 |
| 2022 | $1,125 | $43,900 | $5,700 | $38,200 |
| 2021 | $1,043 | $40,700 | $5,700 | $35,000 |
| 2020 | $1,099 | $42,900 | $5,700 | $37,200 |
| 2019 | $918 | $42,900 | $5,700 | $37,200 |
| 2018 | $1,045 | $42,900 | $5,700 | $37,200 |
| 2017 | $1,000 | $43,500 | $5,700 | $37,800 |
| 2016 | $1,026 | $45,300 | $5,700 | $39,600 |
| 2014 | $1,168 | $49,900 | $6,400 | $43,500 |
| 2013 | $1,083 | $48,200 | $6,400 | $41,800 |
Source: Public Records
Map
Nearby Homes
- 880 Gerry St
- 809 Clinton St
- 1024 Ralston St Unit 30
- 621 Burr St
- 556 Gerry St
- 1045 - 1051 Durbin St
- 349 Hamlin St
- 456 Gerry St
- 984 Stevenson St
- 801 Hobart St
- 451 Hamlin St
- 1528 Hanley St
- 1152 Hovey St
- 344 Gerry St
- 364 Durbin St
- 5438 W 15th Ave
- 313 Dallas St
- 1755 Ralston St
- 4408 W 10th Ave
- 4429 W 13th Ave
Your Personal Tour Guide
Ask me questions while you tour the home.