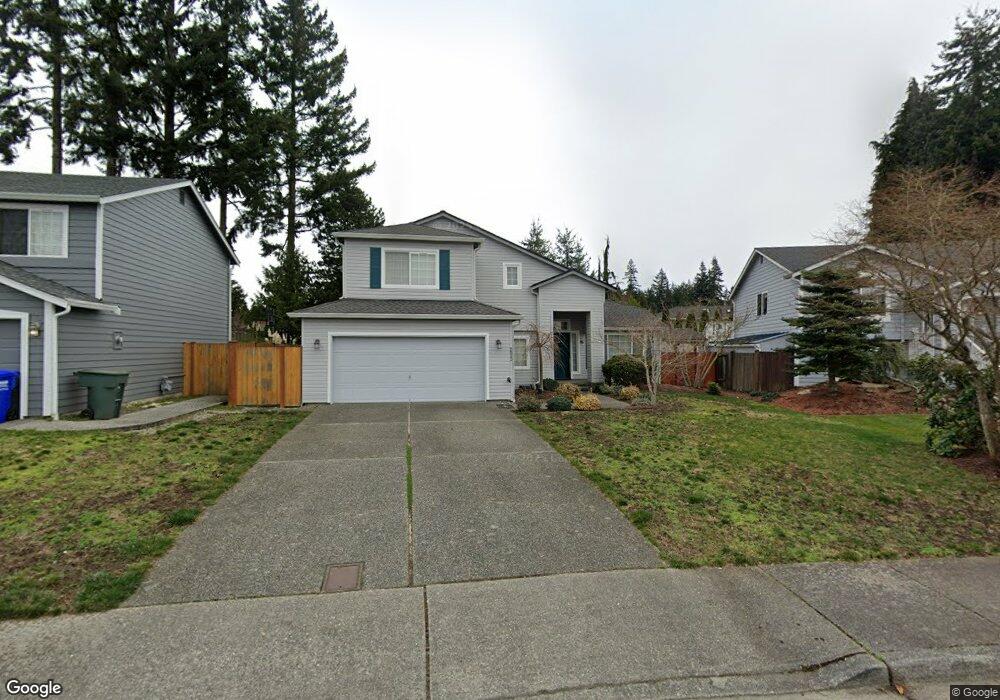
5523 1st Ave SE Everett, WA 98203
View Ridge Madison NeighborhoodEstimated Value: $747,898 - $806,000
4
Beds
3
Baths
2,033
Sq Ft
$382/Sq Ft
Est. Value
About This Home
This home is located at 5523 1st Ave SE, Everett, WA 98203 and is currently estimated at $776,725, approximately $382 per square foot. 5523 1st Ave SE is a home located in Snohomish County with nearby schools including View Ridge Elementary School, Evergreen Middle School, and Everett High School.
Ownership History
Date
Name
Owned For
Owner Type
Purchase Details
Closed on
Mar 19, 2001
Sold by
Morris Scott L and Morris Renee M
Bought by
Pham Nghi D and Bui Hao P
Current Estimated Value
Home Financials for this Owner
Home Financials are based on the most recent Mortgage that was taken out on this home.
Original Mortgage
$206,770
Outstanding Balance
$70,330
Interest Rate
6.98%
Estimated Equity
$706,396
Purchase Details
Closed on
Feb 17, 1998
Sold by
Morris Scott L and Morris Renee M
Bought by
Morris Scott L and Morris Renee M
Home Financials for this Owner
Home Financials are based on the most recent Mortgage that was taken out on this home.
Original Mortgage
$151,000
Interest Rate
6.97%
Purchase Details
Closed on
May 31, 1994
Sold by
Colony Craft Inc
Bought by
Morris Scott L and Therien Renee M
Home Financials for this Owner
Home Financials are based on the most recent Mortgage that was taken out on this home.
Original Mortgage
$160,400
Interest Rate
8.35%
Create a Home Valuation Report for This Property
The Home Valuation Report is an in-depth analysis detailing your home's value as well as a comparison with similar homes in the area
Home Values in the Area
Average Home Value in this Area
Purchase History
| Date | Buyer | Sale Price | Title Company |
|---|---|---|---|
| Pham Nghi D | $230,000 | -- | |
| Morris Scott L | -- | Chicago Title Insurance Co | |
| Morris Scott L | $178,240 | Transamerica Title Ins Co |
Source: Public Records
Mortgage History
| Date | Status | Borrower | Loan Amount |
|---|---|---|---|
| Open | Pham Nghi D | $206,770 | |
| Previous Owner | Morris Scott L | $151,000 | |
| Previous Owner | Morris Scott L | $160,400 |
Source: Public Records
Tax History
| Year | Tax Paid | Tax Assessment Tax Assessment Total Assessment is a certain percentage of the fair market value that is determined by local assessors to be the total taxable value of land and additions on the property. | Land | Improvement |
|---|---|---|---|---|
| 2026 | $5,769 | $690,000 | $396,000 | $294,000 |
| 2025 | $5,417 | $660,600 | $380,000 | $280,600 |
| 2024 | $5,417 | $629,600 | $349,000 | $280,600 |
| 2023 | $5,550 | $674,600 | $350,000 | $324,600 |
| 2022 | $4,670 | $509,200 | $244,000 | $265,200 |
| 2020 | $4,941 | $439,500 | $210,000 | $229,500 |
| 2019 | $4,567 | $408,800 | $192,000 | $216,800 |
| 2018 | $4,450 | $365,200 | $160,000 | $205,200 |
| 2017 | $4,038 | $330,100 | $139,000 | $191,100 |
| 2016 | $3,530 | $303,300 | $124,000 | $179,300 |
| 2015 | $3,455 | $279,600 | $109,000 | $170,600 |
| 2013 | $3,197 | $228,300 | $87,000 | $141,300 |
Source: Public Records
Map
Nearby Homes
- 16 60th Place SE
- 5620 Seahurst Ave
- 6327 Polk Place
- 5909 Glenwood Ave
- 5525 Glenwood Ave
- 5209 Glenwood Ave
- 5304 Fleming St Unit B
- 5300 Glenwood Ave Unit R1
- 5300 Glenwood Ave Unit U2
- 6303 Cady Rd
- 6302 Fleming St
- 330 Elm St Unit 201
- 6518 Cady Rd
- 1230 58th St SW Unit A1
- 4711 Castle Ln
- 1033 W Mukilteo Blvd
- 212 Madison St
- 5809 Highway Place Unit A203
- 1621 Edgemoor Ln
- 6325 Evergreen Way
- 5531 1st Ave SE
- 5519 1st Ave SE
- 5601 1st Ave SE
- 5502 W Highland Rd
- 5504 W Highland Rd
- 5508 Highland Rd
- 5514 Highland Rd
- 5511 1st Ave SE
- 5532 1st Ave SE
- 5408 W Highland Rd
- 5606 Highland Rd
- 9 56th Place SE
- 5505 1st Ave SE
- 5522 1st Ave SE
- 21 56th Place SE
- 5614 Highland Rd
- 5404 W Highland Rd
- 5512 1st Ave SE
- 5615 1st Ave SE
- 5615 1st Ave SE
Your Personal Tour Guide
Ask me questions while you tour the home.