5523 Deer Run Rd Langley, WA 98260
Estimated Value: $987,000 - $1,065,000
3
Beds
3
Baths
2,470
Sq Ft
$414/Sq Ft
Est. Value
About This Home
This home is located at 5523 Deer Run Rd, Langley, WA 98260 and is currently estimated at $1,023,073, approximately $414 per square foot. 5523 Deer Run Rd is a home located in Island County with nearby schools including South Whidbey Elementary School, South Whidbey Middle School, and South Whidbey High School.
Ownership History
Date
Name
Owned For
Owner Type
Purchase Details
Closed on
Nov 18, 2010
Sold by
Turpin Jack W
Bought by
Turpin Jack W and Margolis Amy
Current Estimated Value
Home Financials for this Owner
Home Financials are based on the most recent Mortgage that was taken out on this home.
Original Mortgage
$391,200
Interest Rate
4.16%
Mortgage Type
New Conventional
Create a Home Valuation Report for This Property
The Home Valuation Report is an in-depth analysis detailing your home's value as well as a comparison with similar homes in the area
Home Values in the Area
Average Home Value in this Area
Purchase History
| Date | Buyer | Sale Price | Title Company |
|---|---|---|---|
| Turpin Jack W | -- | None Available |
Source: Public Records
Mortgage History
| Date | Status | Borrower | Loan Amount |
|---|---|---|---|
| Closed | Turpin Jack W | $391,200 |
Source: Public Records
Tax History
| Year | Tax Paid | Tax Assessment Tax Assessment Total Assessment is a certain percentage of the fair market value that is determined by local assessors to be the total taxable value of land and additions on the property. | Land | Improvement |
|---|---|---|---|---|
| 2025 | $5,713 | $799,407 | $380,000 | $419,407 |
| 2024 | $5,110 | $793,890 | $350,000 | $443,890 |
| 2023 | $5,110 | $779,420 | $330,000 | $449,420 |
| 2022 | $4,721 | $701,963 | $290,000 | $411,963 |
| 2021 | $3,772 | $592,590 | $230,000 | $362,590 |
| 2020 | $3,588 | $481,295 | $190,000 | $291,295 |
| 2019 | $3,310 | $469,842 | $250,000 | $219,842 |
| 2018 | $3,415 | $430,552 | $210,000 | $220,552 |
| 2017 | $2,729 | $411,689 | $190,000 | $221,689 |
| 2016 | $2,837 | $359,530 | $135,000 | $224,530 |
| 2015 | $2,918 | $362,374 | $135,000 | $227,374 |
| 2013 | -- | $388,531 | $155,840 | $232,691 |
Source: Public Records
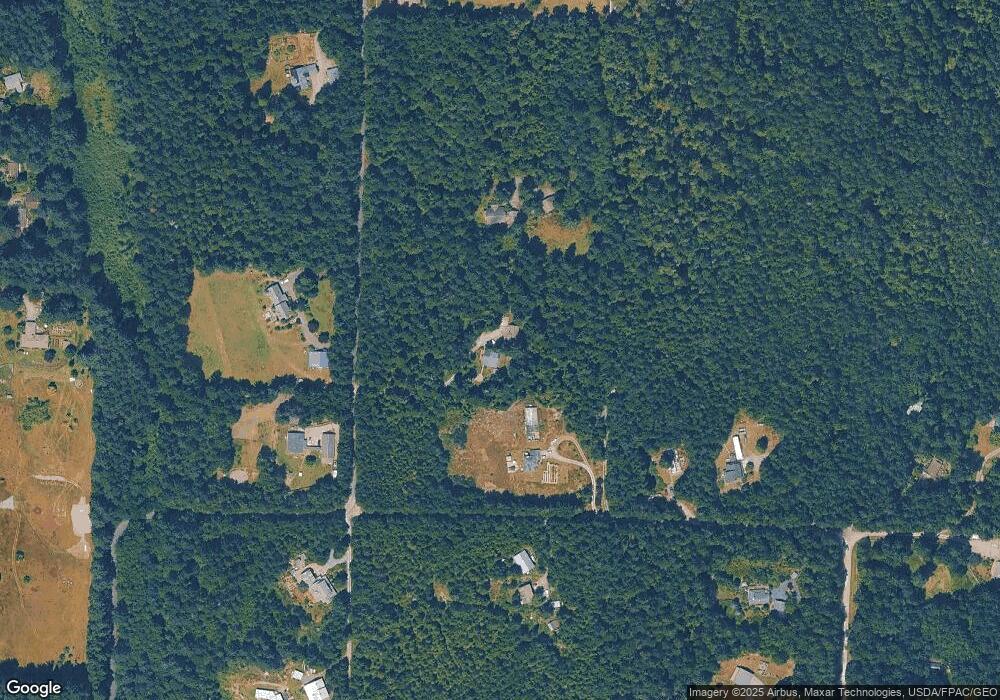
Map
Nearby Homes
- 11652 State Route 525
- 0 XXX Coles Rd
- 240 Clover Ct
- 5777 Kramer Rd
- 5180 Camelot Ct
- 0 April Dr
- 730 Gleason Ln
- 0 Kramer Rd Unit NWM2475719
- 5474 Wilkinson Rd
- 4976 Carlie Dr
- 4282 Witter Rd
- 4955 Wheel Dr
- 321 Edgecliff Dr
- 0 XXX Sandy Point Rd
- 566 Creekside Terrace Unit 101
- 4105 Tartan Way
- 683 3rd St Unit 1(A)
- 4119 Tartan Way
- 624 A, B & C 2nd St
- 0 Primavera Place
- 3571 Rabbit Run Rd
- 5481 Deer Run Rd
- 5530 Deer Run Rd
- 5526 Deer Run Rd
- 3584 Rabbit Run Rd
- 3643 Rabbit Run Rd
- 5559 Deer Run Rd
- 5464 Deer Run Rd
- 5550 Winona Ln
- 5565 Deer Run Rd
- 5441 Deer Run Rd
- 5586 Winona Ln
- 5623 Green Hemlock Ln
- 5515 Coles Rd
- 5489 Coles Rd
- 5436 Deer Run Rd
- 5487 Coles Rd
- 5543 Coles Rd
- 3667 Rabbit Run Rd
- 0 XXX Green Hemlock Ln
Your Personal Tour Guide
Ask me questions while you tour the home.