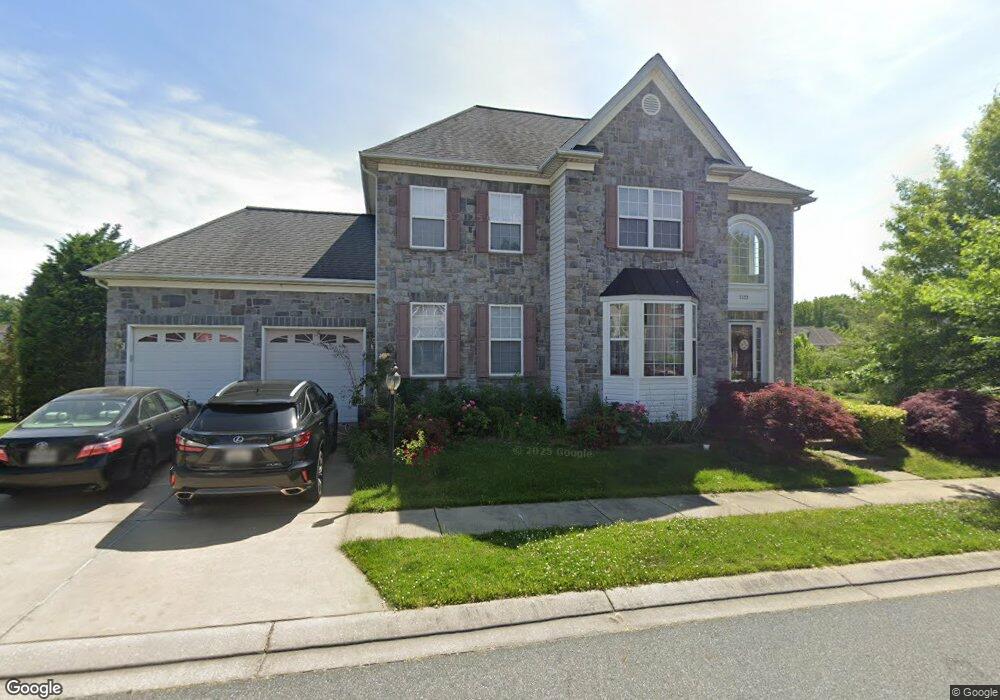
5523 Overlook Cir White Marsh, MD 21162
Estimated Value: $578,027 - $628,000
4
Beds
3
Baths
2,577
Sq Ft
$232/Sq Ft
Est. Value
About This Home
This home is located at 5523 Overlook Cir, White Marsh, MD 21162 and is currently estimated at $598,507, approximately $232 per square foot. 5523 Overlook Cir is a home located in Baltimore County with nearby schools including Chapel Hill Elementary School, Perry Hall Middle School, and Perry Hall High School.
Ownership History
Date
Name
Owned For
Owner Type
Purchase Details
Closed on
Jun 15, 2006
Sold by
Tousa Homes Inc
Bought by
Saavedra Lorela T and Saavedra Eugenio M
Current Estimated Value
Home Financials for this Owner
Home Financials are based on the most recent Mortgage that was taken out on this home.
Original Mortgage
$97,450
Outstanding Balance
$55,742
Interest Rate
6.28%
Mortgage Type
Credit Line Revolving
Estimated Equity
$542,765
Purchase Details
Closed on
Mar 31, 2006
Sold by
Tousa Homes Inc
Bought by
Saavedra Lorela T and Saavedra Eugenio M
Home Financials for this Owner
Home Financials are based on the most recent Mortgage that was taken out on this home.
Original Mortgage
$389,800
Interest Rate
6.28%
Mortgage Type
Stand Alone Second
Purchase Details
Closed on
May 26, 2005
Sold by
Gamma Construction Company
Bought by
Tousa Homes Inc and T/A Engle Homes
Create a Home Valuation Report for This Property
The Home Valuation Report is an in-depth analysis detailing your home's value as well as a comparison with similar homes in the area
Home Values in the Area
Average Home Value in this Area
Purchase History
| Date | Buyer | Sale Price | Title Company |
|---|---|---|---|
| Saavedra Lorela T | $487,295 | -- | |
| Saavedra Lorela T | $487,295 | -- | |
| Tousa Homes Inc | $4,100,000 | -- |
Source: Public Records
Mortgage History
| Date | Status | Borrower | Loan Amount |
|---|---|---|---|
| Open | Saavedra Lorela T | $97,450 | |
| Open | Saavedra Lorela T | $389,800 | |
| Closed | Saavedra Lorela T | $97,450 | |
| Previous Owner | Saavedra Lorela T | $389,800 |
Source: Public Records
Tax History
| Year | Tax Paid | Tax Assessment Tax Assessment Total Assessment is a certain percentage of the fair market value that is determined by local assessors to be the total taxable value of land and additions on the property. | Land | Improvement |
|---|---|---|---|---|
| 2025 | $6,543 | $452,967 | -- | -- |
| 2024 | $6,543 | $437,033 | $0 | $0 |
| 2023 | $3,502 | $421,100 | $127,100 | $294,000 |
| 2022 | $6,306 | $412,533 | $0 | $0 |
| 2021 | $5,487 | $403,967 | $0 | $0 |
| 2020 | $5,487 | $395,400 | $127,100 | $268,300 |
| 2019 | $5,257 | $395,400 | $127,100 | $268,300 |
| 2018 | $5,968 | $395,400 | $127,100 | $268,300 |
| 2017 | $6,125 | $416,500 | $0 | $0 |
| 2016 | $6,311 | $398,367 | $0 | $0 |
| 2015 | $6,311 | $380,233 | $0 | $0 |
| 2014 | $6,311 | $362,100 | $0 | $0 |
Source: Public Records
Map
Nearby Homes
- 5603 Overlook Ct
- 5510 Rogue Ct
- 11400 Eunice Ct
- 5113 Robins Perch Ln
- 11540 Philadelphia Rd Unit 5
- 9307 Georgia Belle Dr
- 0 Joppa Unit MDBC2128884
- 0 Joppa Unit MDBC2143452
- 5703 Allender Rd
- 7 Bangert Ave
- 11617 Philadelphia Rd
- 5706 Allender Rd
- 11503 Jerome Ave
- 0 New Forge Rd Unit MDBC2153490
- 11604 Jerome Ave
- 5200 Scenic Dr
- TBD Vista Reserve - Homesite Vista Unit 111
- TBD Vista Reserve - Homesite Vista Unit 82 - 3 Finished Leve
- 11258 Davisar Rd Unit 89
- 9406 Gerst Rd
- 5525 Overlook Cir
- 5524 Overlook Cir
- 5522 Overlook Cir
- 5507 Overlook Cir
- 5527 Overlook Cir
- 5505 Overlook Cir
- 5526 Overlook Cir
- 5509 Overlook Cir
- 5503 Overlook Cir
- 5520 Overlook Cir
- 5505 Kathryns Ct
- 5528 Overlook Cir
- 5509 Kathryns Ct
- 5518 Overlook Cir
- 5529 Overlook Cir
- 5511 Kathryns Ct
- 5503 Kathryns Ct
- 5516 Overlook Cir
- 5501 Overlook Cir
- 5504 Overlook Cir
Your Personal Tour Guide
Ask me questions while you tour the home.