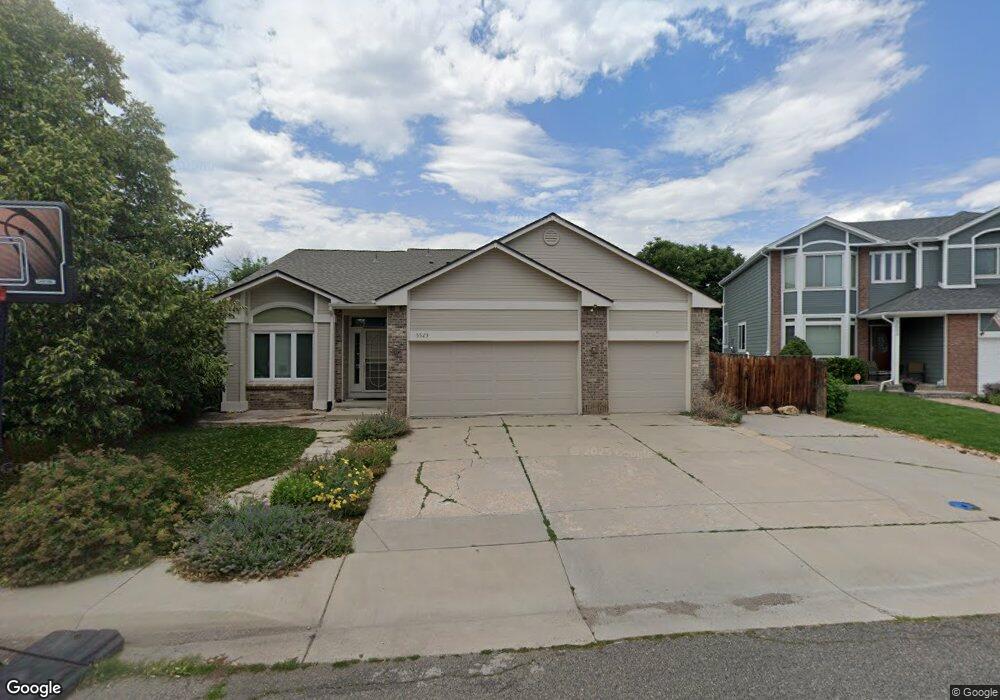
5523 Yank Way Arvada, CO 80002
Appleridge Estates NeighborhoodEstimated Value: $824,984 - $968,000
4
Beds
3
Baths
3,860
Sq Ft
$236/Sq Ft
Est. Value
About This Home
This home is located at 5523 Yank Way, Arvada, CO 80002 and is currently estimated at $912,496, approximately $236 per square foot. 5523 Yank Way is a home located in Jefferson County with nearby schools including Fairmount Elementary School, Drake Junior High School, and Arvada West High School.
Ownership History
Date
Name
Owned For
Owner Type
Purchase Details
Closed on
Apr 26, 2013
Sold by
Sippel Carol L
Bought by
Coffing Bryan Neil and Coffing Mia Jo
Current Estimated Value
Home Financials for this Owner
Home Financials are based on the most recent Mortgage that was taken out on this home.
Original Mortgage
$344,000
Outstanding Balance
$244,853
Interest Rate
3.58%
Mortgage Type
New Conventional
Estimated Equity
$667,643
Purchase Details
Closed on
Sep 26, 2000
Sold by
Michelle Gibler Chris Maestas
Bought by
Alberts John L and Sippel Carol L
Home Financials for this Owner
Home Financials are based on the most recent Mortgage that was taken out on this home.
Original Mortgage
$150,000
Interest Rate
7.97%
Purchase Details
Closed on
Jun 9, 1995
Sold by
Gallery At Cherrywood Inc
Bought by
Gibler Chris and Maestas Michelle
Home Financials for this Owner
Home Financials are based on the most recent Mortgage that was taken out on this home.
Original Mortgage
$151,000
Interest Rate
8.2%
Create a Home Valuation Report for This Property
The Home Valuation Report is an in-depth analysis detailing your home's value as well as a comparison with similar homes in the area
Home Values in the Area
Average Home Value in this Area
Purchase History
| Date | Buyer | Sale Price | Title Company |
|---|---|---|---|
| Coffing Bryan Neil | $430,000 | Chicago Title Co | |
| Alberts John L | $350,000 | -- | |
| Gibler Chris | $188,758 | Land Title |
Source: Public Records
Mortgage History
| Date | Status | Borrower | Loan Amount |
|---|---|---|---|
| Open | Coffing Bryan Neil | $344,000 | |
| Previous Owner | Alberts John L | $150,000 | |
| Previous Owner | Gibler Chris | $151,000 |
Source: Public Records
Tax History Compared to Growth
Tax History
| Year | Tax Paid | Tax Assessment Tax Assessment Total Assessment is a certain percentage of the fair market value that is determined by local assessors to be the total taxable value of land and additions on the property. | Land | Improvement |
|---|---|---|---|---|
| 2024 | $5,044 | $51,806 | $9,467 | $42,339 |
| 2023 | $5,044 | $51,806 | $9,467 | $42,339 |
| 2022 | $4,003 | $40,715 | $10,969 | $29,746 |
| 2021 | $4,061 | $41,887 | $11,285 | $30,602 |
| 2020 | $3,975 | $41,057 | $15,541 | $25,516 |
| 2019 | $3,920 | $41,057 | $15,541 | $25,516 |
| 2018 | $3,461 | $35,243 | $10,017 | $25,226 |
| 2017 | $3,168 | $35,243 | $10,017 | $25,226 |
| 2016 | $3,425 | $35,844 | $9,791 | $26,053 |
| 2015 | $2,922 | $35,844 | $9,791 | $26,053 |
| 2014 | $2,922 | $29,890 | $8,597 | $21,293 |
Source: Public Records
Map
Nearby Homes
- 5284 Braun St
- 5555 Ward Rd
- 5188 Ward Rd
- 5160 Ward Rd
- 5173 Vivian St
- 12355 W 51st Ave
- 13030 W 58th Ave
- 5795 Xenon Way
- 12081 W 54th Ave
- 5154 Taft Ct
- 12321 W 58th Dr
- 14290 W 54th Ave
- 11958 W 57th Place
- 5287 Flora Way
- 11944 W 57th Dr
- 11924 W 57th Dr
- 5779 Taft St
- 6003 Yank Ct
- 5726 Fig Ct
- 12017 W 58th Place
- 5483 Yank Way
- 5553 Yank Way
- 5522 Yank Way
- 5463 Yank Way
- 5552 Yank Way
- 5482 Yank Way
- 12999 W 55th Place
- 12989 W 55th Place
- 5462 Yank Way
- 5433 Yank Way
- 12969 W 55th Place
- 5521 Youngfield Way
- 5551 Youngfield Way
- 5481 Youngfield Way
- 5432 Yank Way
- 5403 Yank Way
- 5461 Youngfield Way
- 12929 W 55th Place
- 13095 W 52nd Ave
- 5402 Yank Way