


5524 Military Sioux City, IA 51109
West Side Sioux City NeighborhoodEstimated payment $1,514/month
About This Lot
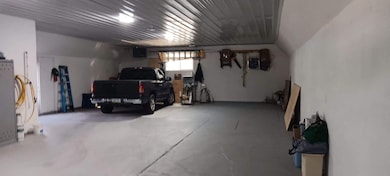
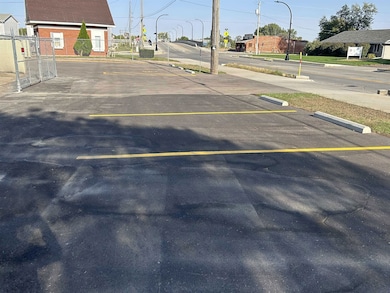
Check out this Riverside warehouse, which is insulated and heated, perfect for a small office!! Handicap accessible bathroom and parking. It has a large lot, 14,063' with fenced in area. Access is from the alleyway. Property is zoned GC General Commercial. It is located just before you go to NSC. There is room to expand your business. The building is 1620'. Fenced area is all seeded. Garage dimensions are appx. 8'5"x 14'. Come take a look!!!
Copyright © 2025 Northwest Iowa Regional Board of Realtors. All rights reserved. All information provided by the listing agent/broker is deemed reliable but is not guaranteed and should be independently verified.
Listing Agent
Terry Hoffman
NextHome Tri State Realty Listed on: 10/07/2024

Property Details
Property Type
- Land
Lot Details
- Waterfront
- Current uses include commercial
- Potential uses include for development
Map
Home Values in the Area
Average Home Value in this Area
Tax History
| Year | Tax Paid | Tax Assessment Tax Assessment Total Assessment is a certain percentage of the fair market value that is determined by local assessors to be the total taxable value of land and additions on the property. | Land | Improvement |
|---|---|---|---|---|
| 2025 | $1,444 | $143,200 | $77,300 | $65,900 |
| 2024 | $1,444 | $83,100 | $30,700 | $52,400 |
| 2023 | $1,666 | $83,100 | $30,700 | $52,400 |
| 2022 | $1,724 | $83,100 | $28,100 | $55,000 |
| 2021 | $1,724 | $52,600 | $28,100 | $24,500 |
| 2020 | $1,030 | $50,600 | $28,100 | $22,500 |
| 2019 | $532 | $23,600 | $0 | $0 |
| 2018 | $526 | $23,600 | $0 | $0 |
| 2017 | $526 | $23,600 | $0 | $0 |
| 2016 | $530 | $23,600 | $0 | $0 |
| 2015 | $893 | $23,600 | $11,300 | $12,300 |
| 2014 | $970 | $24,300 | $10,000 | $14,300 |
Property History
| Date | Event | Price | List to Sale | Price per Sq Ft |
|---|---|---|---|---|
| 12/12/2025 12/12/25 | For Sale | $265,000 | 0.0% | -- |
| 09/17/2025 09/17/25 | Off Market | $265,000 | -- | -- |
| 05/07/2025 05/07/25 | For Sale | $265,000 | 0.0% | -- |
| 05/06/2025 05/06/25 | Off Market | $265,000 | -- | -- |
| 10/07/2024 10/07/24 | For Sale | $265,000 | -- | -- |
- 2605 Home St
- 1125 Edgewater Ave
- 1136 Edgewater Ave
- 1121 River Dr
- 1335 Edgewater Ave
- 2510 Wilson St
- 1219 Goldie Ave
- 2216 Boise St
- 2207 Boies St
- 201 N Main St
- 800 Paul Ave
- 931 Campbell St
- 929 Campbell St
- 1309 Quiniela Dr
- 114 Cott's Dr
- 910 S Turtle Cove
- 908 S Turtle Cove
- 2901 Amanda St
- 101 Cott's Dr N
- 2120 S Jermyn St
- 1300-1302 Quiniela Dr
- 741 Streeter Dr
- 749 Streeter Dr
- 19 Whitetail Place
- 240 Courtyard Dr
- 4333 Fieldcrest Dr
- 303 Dakota Dunes Blvd
- 340 Streeter Dr
- 1819 W Horne Ave Unit 1819
- 55 W Clifton Ave
- 353 Wesley Pkwy
- 609-615 Pearl St
- 705 Douglas St
- 413 Pierce St
- 2951 Park Ave
- 520 Nebraska St
- 4201 Denice Ct
- 622 4th St
- 3900-3937 Winona Way
- 130 Nebraska St