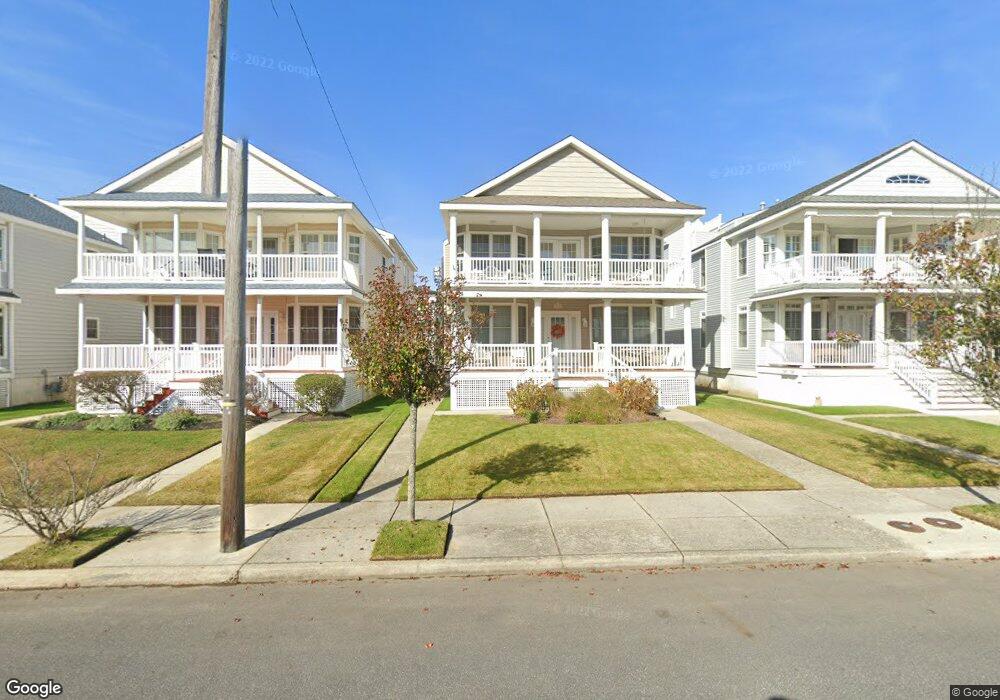
5524 Simpson Ave Unit 26 Ocean City, NJ 08226
Estimated Value: $1,012,115 - $1,132,000
--
Bed
--
Bath
1,460
Sq Ft
$741/Sq Ft
Est. Value
About This Home
This home is located at 5524 Simpson Ave Unit 26, Ocean City, NJ 08226 and is currently estimated at $1,082,029, approximately $741 per square foot. 5524 Simpson Ave Unit 26 is a home located in Cape May County with nearby schools including Ocean City Primary School, Ocean City Intermediate School, and Ocean City High School.
Ownership History
Date
Name
Owned For
Owner Type
Purchase Details
Closed on
Aug 10, 2022
Sold by
Christiansen David A and Christiansen Marybeth
Bought by
Tulli Stephen A and Tulli Maria
Current Estimated Value
Home Financials for this Owner
Home Financials are based on the most recent Mortgage that was taken out on this home.
Original Mortgage
$720,000
Outstanding Balance
$688,356
Interest Rate
5.51%
Mortgage Type
Balloon
Estimated Equity
$393,673
Purchase Details
Closed on
Jun 22, 2009
Sold by
Christianson David A and Christianson Marybeth
Bought by
Christiansen David A and Christiansen Marybeth
Home Financials for this Owner
Home Financials are based on the most recent Mortgage that was taken out on this home.
Original Mortgage
$417,000
Interest Rate
5.21%
Mortgage Type
New Conventional
Create a Home Valuation Report for This Property
The Home Valuation Report is an in-depth analysis detailing your home's value as well as a comparison with similar homes in the area
Home Values in the Area
Average Home Value in this Area
Purchase History
| Date | Buyer | Sale Price | Title Company |
|---|---|---|---|
| Tulli Stephen A | $995,000 | Trident Land Transfer | |
| Christiansen David A | -- | None Available |
Source: Public Records
Mortgage History
| Date | Status | Borrower | Loan Amount |
|---|---|---|---|
| Open | Tulli Stephen A | $720,000 | |
| Previous Owner | Christiansen David A | $417,000 |
Source: Public Records
Tax History Compared to Growth
Tax History
| Year | Tax Paid | Tax Assessment Tax Assessment Total Assessment is a certain percentage of the fair market value that is determined by local assessors to be the total taxable value of land and additions on the property. | Land | Improvement |
|---|---|---|---|---|
| 2025 | $5,877 | $523,800 | $248,000 | $275,800 |
| 2024 | $5,877 | $523,800 | $248,000 | $275,800 |
| 2023 | $5,610 | $523,800 | $248,000 | $275,800 |
| 2022 | $5,390 | $523,800 | $248,000 | $275,800 |
| 2021 | $3,908 | $523,800 | $248,000 | $275,800 |
| 2020 | $5,123 | $523,800 | $248,000 | $275,800 |
| 2019 | $5,065 | $523,800 | $248,000 | $275,800 |
| 2018 | $5,018 | $523,800 | $248,000 | $275,800 |
| 2017 | $4,939 | $523,800 | $248,000 | $275,800 |
| 2016 | $4,751 | $523,800 | $248,000 | $275,800 |
| 2015 | $4,688 | $523,800 | $248,000 | $275,800 |
| 2014 | $4,620 | $523,800 | $248,000 | $275,800 |
Source: Public Records
Map
Nearby Homes
- 216 Anchorage Dr
- 5404 Bay Ave
- 209 Bark Dr
- 5512 Asbury Ave
- 400 E 55th St Unit D
- 400 E 55th St Unit E
- 400 E 55th St Unit F
- 305 57th St Unit 305
- 13 53rd St
- 5315 West Ave
- 5242 West Ave Unit 2
- 5225 Asbury Ave Unit 1
- 5235 Central Ave
- 5132 Central Ave
- 4933 Central Ave Unit 4933
- 4919 Central Ave
- 4923 Central Ave Unit 2
- 4828 West Ave Unit first floor
- 4818-20 Asbury Ave
- 4818 Asbury Ave Unit 1
- 5524 Simpson Ave Unit 26
- 5528 Simpson Ave Unit 30
- 5528 Simpson Ave Unit 30
- 5520 Simpson Ave Unit 1
- 5520 Simpson Ave Unit 22
- 5520 Simpson Ave Unit 22
- 5516 Simpson Ave Unit 18
- 5516 Simpson Ave Unit 18
- 5532 Simpson Ave Unit 1st FL
- 5532 Simpson Ave Unit 34
- 5532 Simpson Ave Unit 34
- 5512 Simpson Ave Unit 14
- 5525 Bay Ave Unit 27
- 5521 Bay Ave Unit 23
- 5529 Bay Ave Unit 31
- 5529 Bay Ave Unit 1st floor
- 5536 Simpson Ave Unit 38
- 5536 Simpson Ave Unit 38
- 5536 Simpson Ave Unit 2
- 5536 Simpson Ave Unit 1