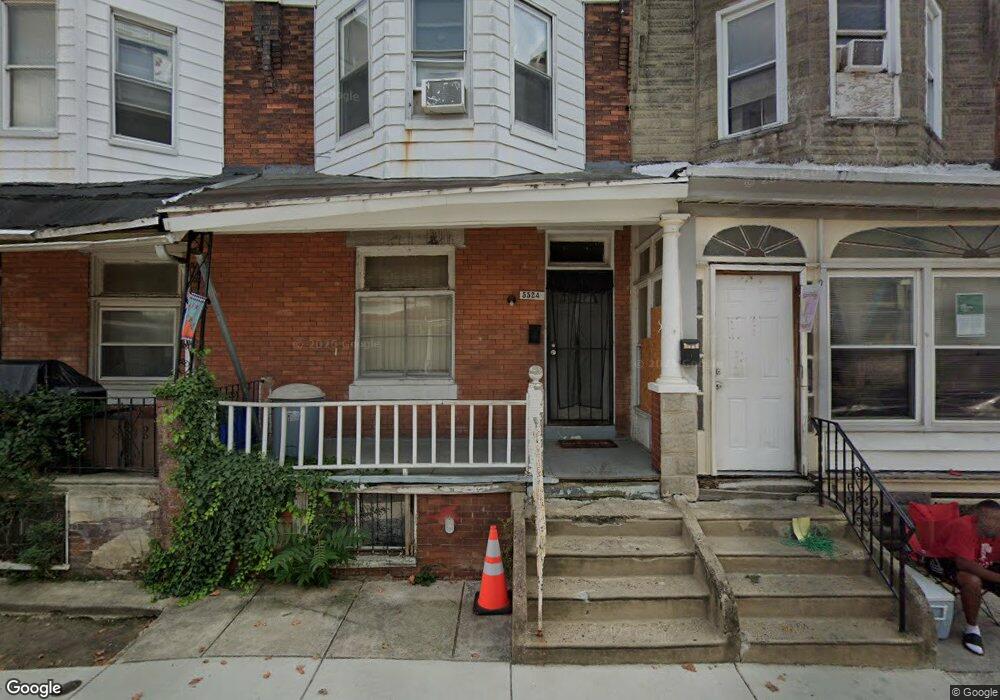
5524 Spring St Philadelphia, PA 19139
Haddington NeighborhoodEstimated Value: $72,543 - $122,000
3
Beds
1
Bath
800
Sq Ft
$130/Sq Ft
Est. Value
About This Home
This home is located at 5524 Spring St, Philadelphia, PA 19139 and is currently estimated at $103,636, approximately $129 per square foot. 5524 Spring St is a home located in Philadelphia County with nearby schools including Overbrook High School, Universal Bluford Charter School, and NSA 63rd Street Multicultural Academy.
Ownership History
Date
Name
Owned For
Owner Type
Purchase Details
Closed on
Jul 16, 2002
Sold by
Sandidge E Paul and Estate Of Aurelia L Johnson
Bought by
Brown Curtis R
Current Estimated Value
Home Financials for this Owner
Home Financials are based on the most recent Mortgage that was taken out on this home.
Original Mortgage
$30,069
Outstanding Balance
$12,765
Interest Rate
6.73%
Mortgage Type
FHA
Estimated Equity
$90,871
Purchase Details
Closed on
Nov 30, 1995
Sold by
Porter Letitia S
Bought by
Johnson Aurelia L
Create a Home Valuation Report for This Property
The Home Valuation Report is an in-depth analysis detailing your home's value as well as a comparison with similar homes in the area
Home Values in the Area
Average Home Value in this Area
Purchase History
| Date | Buyer | Sale Price | Title Company |
|---|---|---|---|
| Brown Curtis R | $30,000 | -- | |
| Johnson Aurelia L | $15,000 | -- |
Source: Public Records
Mortgage History
| Date | Status | Borrower | Loan Amount |
|---|---|---|---|
| Open | Brown Curtis R | $30,069 |
Source: Public Records
Tax History Compared to Growth
Tax History
| Year | Tax Paid | Tax Assessment Tax Assessment Total Assessment is a certain percentage of the fair market value that is determined by local assessors to be the total taxable value of land and additions on the property. | Land | Improvement |
|---|---|---|---|---|
| 2025 | $662 | $74,400 | $14,880 | $59,520 |
| 2024 | $662 | $74,400 | $14,880 | $59,520 |
| 2023 | $662 | $47,300 | $9,460 | $37,840 |
| 2022 | $32 | $2,300 | $2,300 | $0 |
| 2021 | $662 | $0 | $0 | $0 |
| 2020 | $662 | $0 | $0 | $0 |
| 2019 | $638 | $0 | $0 | $0 |
| 2018 | $358 | $0 | $0 | $0 |
| 2017 | $358 | $0 | $0 | $0 |
| 2016 | -- | $0 | $0 | $0 |
| 2015 | -- | $0 | $0 | $0 |
| 2014 | -- | $25,600 | $3,018 | $22,582 |
| 2012 | -- | $4,192 | $698 | $3,494 |
Source: Public Records
Map
Nearby Homes