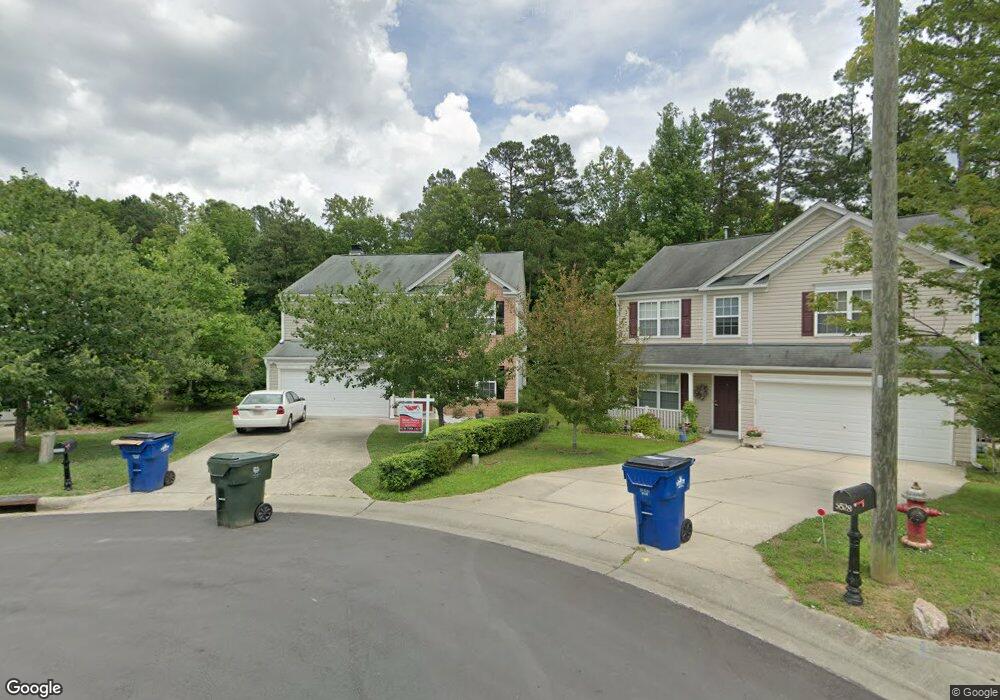
5525 Bridgeman Ct Durham, NC 27703
Eastern Durham NeighborhoodEstimated Value: $457,000 - $486,000
4
Beds
3
Baths
2,258
Sq Ft
$211/Sq Ft
Est. Value
About This Home
This home is located at 5525 Bridgeman Ct, Durham, NC 27703 and is currently estimated at $476,008, approximately $210 per square foot. 5525 Bridgeman Ct is a home located in Durham County with nearby schools including Spring Valley Elementary School, John W Neal Middle School, and Southern School of Energy & Sustainability.
Ownership History
Date
Name
Owned For
Owner Type
Purchase Details
Closed on
Mar 14, 2024
Sold by
Hosking John Francis and Hosking Ann Christine
Bought by
Lefcheck Kelly Ann and Hosking Sean Eric
Current Estimated Value
Purchase Details
Closed on
Sep 4, 2019
Sold by
Peters Jason R and Peters Megan N
Bought by
Hosking John and Hosking Ann
Home Financials for this Owner
Home Financials are based on the most recent Mortgage that was taken out on this home.
Original Mortgage
$252,000
Interest Rate
3.7%
Mortgage Type
VA
Purchase Details
Closed on
Sep 20, 2012
Sold by
Hudson Juliann and Hudson Donald C
Bought by
Peters Jason R and Peters Megan N
Home Financials for this Owner
Home Financials are based on the most recent Mortgage that was taken out on this home.
Original Mortgage
$197,448
Interest Rate
3.63%
Mortgage Type
New Conventional
Purchase Details
Closed on
Sep 19, 2003
Sold by
Colony Homes Llc
Bought by
Hudson Julieanne and Hudson Donald C
Home Financials for this Owner
Home Financials are based on the most recent Mortgage that was taken out on this home.
Original Mortgage
$177,422
Interest Rate
6.24%
Mortgage Type
FHA
Create a Home Valuation Report for This Property
The Home Valuation Report is an in-depth analysis detailing your home's value as well as a comparison with similar homes in the area
Home Values in the Area
Average Home Value in this Area
Purchase History
| Date | Buyer | Sale Price | Title Company |
|---|---|---|---|
| Lefcheck Kelly Ann | $3,000 | None Listed On Document | |
| Hosking John | $252,000 | None Available | |
| Peters Jason R | $194,000 | None Available | |
| Hudson Julieanne | $182,000 | -- |
Source: Public Records
Mortgage History
| Date | Status | Borrower | Loan Amount |
|---|---|---|---|
| Previous Owner | Hosking John | $252,000 | |
| Previous Owner | Peters Jason R | $197,448 | |
| Previous Owner | Hudson Julieanne | $177,422 | |
| Closed | Hudson Julieanne | $7,096 |
Source: Public Records
Tax History Compared to Growth
Tax History
| Year | Tax Paid | Tax Assessment Tax Assessment Total Assessment is a certain percentage of the fair market value that is determined by local assessors to be the total taxable value of land and additions on the property. | Land | Improvement |
|---|---|---|---|---|
| 2025 | $4,384 | $482,155 | $115,200 | $366,955 |
| 2024 | $2,955 | $256,166 | $46,008 | $210,158 |
| 2023 | $3,036 | $256,166 | $46,008 | $210,158 |
| 2022 | $2,857 | $256,166 | $46,008 | $210,158 |
| 2021 | $2,806 | $256,166 | $46,008 | $210,158 |
| 2020 | $2,734 | $256,166 | $46,008 | $210,158 |
| 2019 | $2,947 | $256,166 | $46,008 | $210,158 |
| 2018 | $2,686 | $220,841 | $41,535 | $179,306 |
| 2017 | $2,635 | $220,841 | $41,535 | $179,306 |
| 2016 | $2,559 | $220,841 | $41,535 | $179,306 |
| 2015 | $2,705 | $222,779 | $43,068 | $179,711 |
| 2014 | $2,666 | $222,779 | $43,068 | $179,711 |
Source: Public Records
Map
Nearby Homes
- 5519 Spindlewood Ct
- Southampton Plan at Running Brook Townes
- Ashland Plan at Running Brook Townes
- Bristol Plan at Running Brook Townes
- 12317 Aberdeen Chase Way
- 10119 2nd Star Ct
- 10132 Marleybone Dr
- 11829 N Exeter Way
- 10112 Marleybone Dr
- 7229 Terregles Dr
- 7224 Ladbrooke St
- 12116 Queensbridge Ct
- 5608 Barham Ct
- 7403 Leesville Rd
- 12012 Shavenrock Place
- 12133 Mabledon Ct
- 6004 Eaglesfield Dr
- 5404 Staysail Ct
- 12018 Mcbride Dr
- 5273 Fairmead Cir
- 5521 Bridgeman Ct
- 5528 Bridgeman Ct
- 5517 Bridgeman Ct
- 5524 Bridgeman Ct
- 5513 Bridgeman Ct
- 5520 Bridgeman Ct
- 5516 Bridgeman Ct
- 12223 N Exeter Way
- 5509 Bridgeman Ct
- 12227 N Exeter Way
- 12219 N Exeter Way
- 5516 Bridford Place
- 5520 Bridford Place
- 5512 Bridford Place
- 5508 Bridgeman Ct
- 5547 Spindlewood Ct
- 5501 Bridgeman Ct
- 5524 Bridford Place
- 5543 Spindlewood Ct
- 5528 Bridford Place