C
Seller's Agent in 2026
Carolyn Paszko
Crossway Realty
(803) 553-5658
131 Total Sales
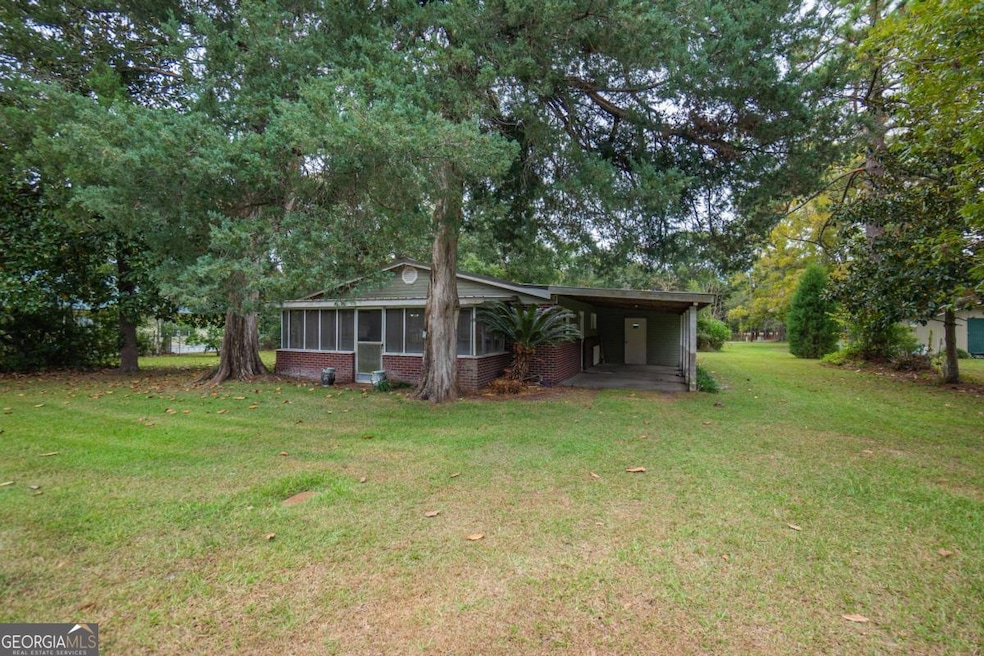
Welcome home to this inviting 3-bedroom, 2-bath partially brick ranch, perfectly situated on a large lot that runs between E Railroad and Hyers Street. You'll love the peaceful small-town setting with plenty of room to stretch out and enjoy the outdoors. Step inside to find a comfortable layout with plenty of natural light and classic charm. Enjoy your morning coffee on the screened front porch or relax in the evenings on the covered back porch overlooking the beautiful yard. The property features mature magnolia and lime trees, lush grapevines, and several storage buildings for all your tools and hobbies. Whether you love gardening, outdoor entertaining, or just want a bit of elbow room, this home has it all. Don't miss this wonderful opportunity to own a piece of small-town tranquility - schedule your showing today!
Last Agent to Sell the Property
Crossway Realty License #408448 Listed on: 10/06/2025
| Date | Type | Sale Price | Title Company |
|---|---|---|---|
| Interfamily Deed Transfer | -- | -- | |
| Deed | $20,000 | -- | |
| Deed | -- | -- | |
| Deed | -- | -- | |
| Deed | -- | -- | |
| Deed | $15,300 | -- | |
| Deed | -- | -- |
| Date | Event | Price | List to Sale | Price per Sq Ft |
|---|---|---|---|---|
| 02/27/2026 02/27/26 | Sold | $150,000 | 0.0% | $106 / Sq Ft |
| 01/28/2026 01/28/26 | Pending | -- | -- | -- |
| 11/17/2025 11/17/25 | Price Changed | $150,000 | -6.3% | $106 / Sq Ft |
| 10/06/2025 10/06/25 | For Sale | $160,000 | -- | $113 / Sq Ft |
| Year | Tax Paid | Tax Assessment Tax Assessment Total Assessment is a certain percentage of the fair market value that is determined by local assessors to be the total taxable value of land and additions on the property. | Land | Improvement |
|---|---|---|---|---|
| 2025 | $1,324 | $43,388 | $2,600 | $40,788 |
| 2024 | $1,324 | $42,138 | $2,600 | $39,538 |
| 2023 | $1,284 | $40,853 | $2,600 | $38,253 |
| 2022 | $760 | $21,422 | $2,309 | $19,113 |
| 2021 | $781 | $20,634 | $2,309 | $18,325 |
| 2020 | $761 | $19,845 | $2,309 | $17,536 |
| 2019 | $761 | $19,845 | $2,309 | $17,536 |
| 2018 | $732 | $19,056 | $2,309 | $16,747 |
| 2017 | $716 | $18,583 | $2,309 | $16,274 |
| 2016 | $714 | $18,583 | $2,309 | $16,274 |
| 2015 | $328 | $18,583 | $2,309 | $16,274 |
| 2014 | $328 | $18,583 | $2,309 | $16,274 |
| 2013 | $328 | $18,583 | $2,309 | $16,274 |
C
Seller's Agent in 2026
Carolyn Paszko
Crossway Realty
(803) 553-5658
131 Total Sales

Buyer's Agent in 2026
Brittany Reynolds
eXp Realty
(912) 282-1618
67 Total Sales
Source: Georgia MLS
MLS Number: 10619962
APN: P03-041
Disclaimer: Certain information contained herein is derived from information provided by parties other than Homes.com. All information provided is deemed reliable, but is not guaranteed to be accurate and should be independently verified.
![]() The data relating to real estate for sale on this web site comes in part from the Broker Reciprocity Program of Georgia MLS. Real estate listings held by brokerage firms other than Redfin are marked with the Broker Reciprocity logo and detailed information about them includes the name of the listing brokers. Information deemed reliable but not guaranteed. Copyright 2026 Georgia MLS. All rights reserved.
The data relating to real estate for sale on this web site comes in part from the Broker Reciprocity Program of Georgia MLS. Real estate listings held by brokerage firms other than Redfin are marked with the Broker Reciprocity logo and detailed information about them includes the name of the listing brokers. Information deemed reliable but not guaranteed. Copyright 2026 Georgia MLS. All rights reserved.
Ask me questions while you tour the home.