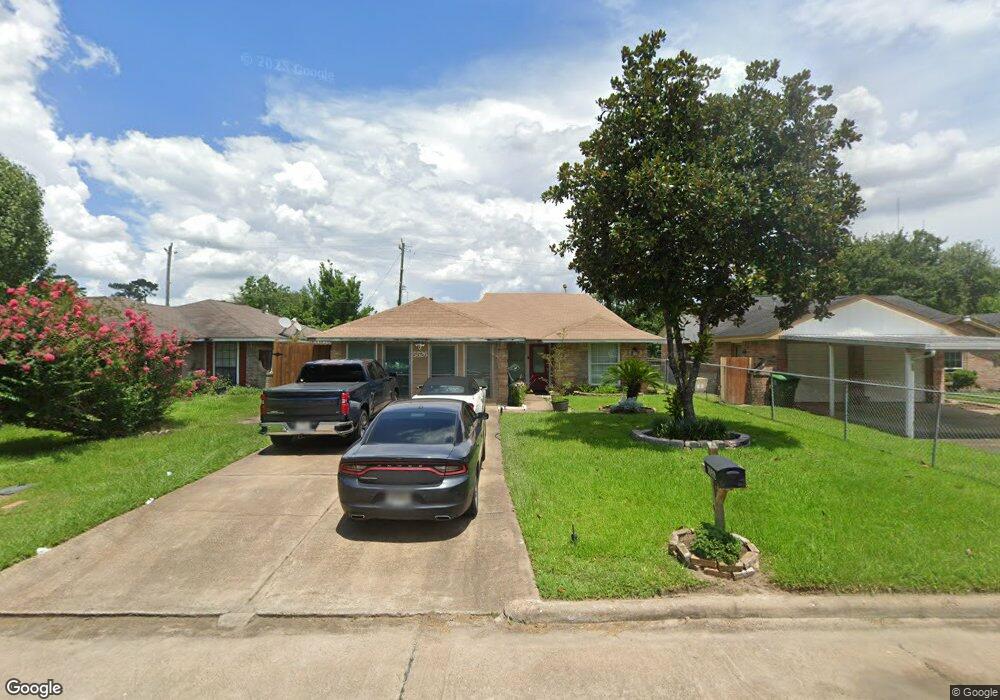
5526 Goldspier St Houston, TX 77091
Acres Homes NeighborhoodEstimated Value: $194,000 - $246,831
3
Beds
2
Baths
1,050
Sq Ft
$216/Sq Ft
Est. Value
About This Home
This home is located at 5526 Goldspier St, Houston, TX 77091 and is currently estimated at $227,208, approximately $216 per square foot. 5526 Goldspier St is a home located in Harris County with nearby schools including Frank Black Middle School, Scarborough High School, and Brazos School For Inquiry And Crea.
Ownership History
Date
Name
Owned For
Owner Type
Purchase Details
Closed on
Feb 1, 2011
Sold by
2010 Swe Llc
Bought by
Mullis Iris M
Current Estimated Value
Home Financials for this Owner
Home Financials are based on the most recent Mortgage that was taken out on this home.
Original Mortgage
$58,500
Interest Rate
5.04%
Mortgage Type
Seller Take Back
Purchase Details
Closed on
Sep 8, 2010
Sold by
Fisher Herschel
Bought by
Citimortgage Inc
Purchase Details
Closed on
Jul 26, 2005
Sold by
Scott Alison
Bought by
Fisher Herschel
Home Financials for this Owner
Home Financials are based on the most recent Mortgage that was taken out on this home.
Original Mortgage
$55,200
Interest Rate
9.3%
Mortgage Type
Fannie Mae Freddie Mac
Purchase Details
Closed on
Nov 17, 2003
Sold by
Scott Lillian Viola Ward
Bought by
Scott Alison
Create a Home Valuation Report for This Property
The Home Valuation Report is an in-depth analysis detailing your home's value as well as a comparison with similar homes in the area
Home Values in the Area
Average Home Value in this Area
Purchase History
| Date | Buyer | Sale Price | Title Company |
|---|---|---|---|
| Mullis Iris M | -- | None Available | |
| Citimortgage Inc | $25,685 | None Available | |
| Fisher Herschel | -- | American Title Co | |
| Scott Alison | -- | American Title Co |
Source: Public Records
Mortgage History
| Date | Status | Borrower | Loan Amount |
|---|---|---|---|
| Previous Owner | Mullis Iris M | $58,500 | |
| Previous Owner | Fisher Herschel | $55,200 |
Source: Public Records
Tax History Compared to Growth
Tax History
| Year | Tax Paid | Tax Assessment Tax Assessment Total Assessment is a certain percentage of the fair market value that is determined by local assessors to be the total taxable value of land and additions on the property. | Land | Improvement |
|---|---|---|---|---|
| 2025 | $4,401 | $228,851 | $89,628 | $139,223 |
| 2024 | $4,401 | $210,359 | $89,628 | $120,731 |
| 2023 | $4,401 | $219,304 | $51,216 | $168,088 |
| 2022 | $3,897 | $175,200 | $44,814 | $130,386 |
| 2021 | $3,433 | $147,295 | $38,412 | $108,883 |
| 2020 | $3,469 | $143,242 | $32,010 | $111,232 |
| 2019 | $3,047 | $120,400 | $32,010 | $88,390 |
| 2018 | $2,798 | $110,570 | $32,010 | $78,560 |
| 2017 | $2,796 | $110,570 | $32,010 | $78,560 |
| 2016 | $2,796 | $110,570 | $32,010 | $78,560 |
| 2015 | -- | $110,570 | $32,010 | $78,560 |
| 2014 | -- | $88,492 | $17,606 | $70,886 |
Source: Public Records
Map
Nearby Homes
- 5503 Goldspier St
- 2582 W Tidwell Rd
- 2598 W Tidwell Rd
- 2592 W Tidwell Rd
- 2591 Paul Quinn St
- 2593 Paul Quinn St
- 2589 Paul Quinn St
- 2587 Paul Quinn St
- 2583 Paul Quinn St
- 2595 Paul Quinn St
- 2581 Paul Quinn St
- 2599 Paul Quinn St
- 2504 W Tidwell Rd Unit C
- 2504 W Tidwell Rd Unit F
- 4206 Oak Shadows Dr
- 2602 Paul Quinn St
- 2632 Paul Quinn
- 5616 Bertellis Ln
- 5314 Teodoro Ln
- 5306 Teodoro Ln
- 5522 Goldspier St
- 5530 Goldspier St
- 5518 Goldspier St
- 5514 Goldspier St
- 5523 Goldspier St
- 5519 Goldspier St
- 5531 Goldspier St
- 5510 Goldspier St
- 5515 Goldspier St
- 5511 Goldspier St
- 5506 Goldspier St
- 5518 Rollins St
- 2626 W Tidwell Rd
- 2626 W Tidwell Rd Unit D
- 2626 W Tidwell Rd Unit C
- 2626 W Tidwell Rd Unit B
- 2626 W Tidwell Rd Unit A
- 2626 W Tidwell Rd Unit E
- 2626 W Tidwell Rd Unit F
- 5507 Goldspier St