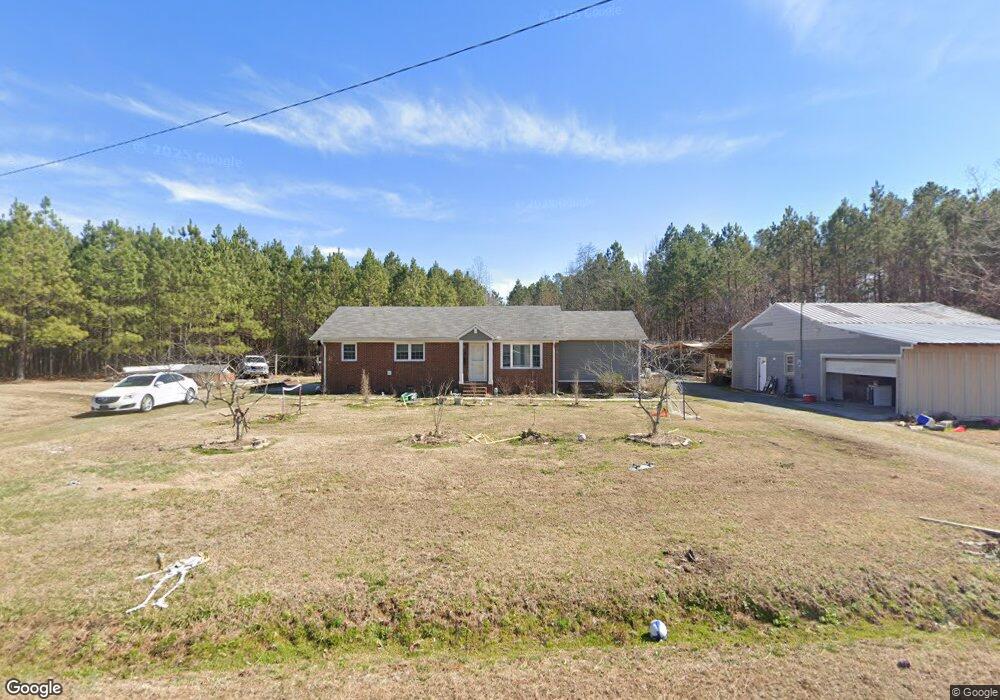
5526 Goochs Mill Rd Oxford, NC 27565
Estimated Value: $252,000 - $348,000
3
Beds
3
Baths
1,607
Sq Ft
$189/Sq Ft
Est. Value
About This Home
This home is located at 5526 Goochs Mill Rd, Oxford, NC 27565 and is currently estimated at $303,730, approximately $189 per square foot. 5526 Goochs Mill Rd is a home located in Granville County with nearby schools including West Oxford Elementary School, Northern Granville Middle School, and Granville Central High School.
Ownership History
Date
Name
Owned For
Owner Type
Purchase Details
Closed on
May 28, 2020
Sold by
Glenn Barry Ray and Glenn Amy
Bought by
Knight Summer
Current Estimated Value
Home Financials for this Owner
Home Financials are based on the most recent Mortgage that was taken out on this home.
Original Mortgage
$185,576
Outstanding Balance
$164,499
Interest Rate
3.2%
Mortgage Type
FHA
Estimated Equity
$139,231
Purchase Details
Closed on
Sep 12, 2017
Sold by
Glenn Barry Ray
Bought by
Glenn Barry Ray and Glenn Amy Jo
Purchase Details
Closed on
May 16, 2014
Sold by
Williams Walter and Williams Marie
Bought by
Glenn Barry Ray
Purchase Details
Closed on
Mar 25, 2011
Sold by
Merrell Adam Wayne and Merrell Jennifer Mitchell
Bought by
Glenn Barry Ray
Home Financials for this Owner
Home Financials are based on the most recent Mortgage that was taken out on this home.
Original Mortgage
$13,800
Interest Rate
4.99%
Mortgage Type
Seller Take Back
Create a Home Valuation Report for This Property
The Home Valuation Report is an in-depth analysis detailing your home's value as well as a comparison with similar homes in the area
Home Values in the Area
Average Home Value in this Area
Purchase History
| Date | Buyer | Sale Price | Title Company |
|---|---|---|---|
| Knight Summer | $189,000 | None Available | |
| Glenn Barry Ray | -- | None Available | |
| Glenn Barry Ray | $3,000 | None Available | |
| Glenn Barry Ray | $25,000 | -- |
Source: Public Records
Mortgage History
| Date | Status | Borrower | Loan Amount |
|---|---|---|---|
| Open | Knight Summer | $185,576 | |
| Previous Owner | Glenn Barry Ray | $13,800 |
Source: Public Records
Tax History Compared to Growth
Tax History
| Year | Tax Paid | Tax Assessment Tax Assessment Total Assessment is a certain percentage of the fair market value that is determined by local assessors to be the total taxable value of land and additions on the property. | Land | Improvement |
|---|---|---|---|---|
| 2025 | $1,674 | $227,014 | $22,501 | $204,513 |
| 2024 | $1,674 | $227,014 | $22,501 | $204,513 |
| 2023 | $1,240 | $124,710 | $14,333 | $110,377 |
| 2022 | $1,219 | $124,710 | $14,333 | $110,377 |
| 2021 | $1,140 | $124,710 | $14,333 | $110,377 |
| 2020 | $1,140 | $124,710 | $14,333 | $110,377 |
| 2019 | $1,140 | $124,710 | $14,333 | $110,377 |
| 2018 | $1,054 | $124,710 | $14,333 | $110,377 |
| 2016 | $227 | $25,114 | $8,588 | $16,526 |
| 2015 | $214 | $25,114 | $8,588 | $16,526 |
| 2014 | $95 | $10,688 | $8,588 | $2,100 |
| 2013 | -- | $10,688 | $8,588 | $2,100 |
Source: Public Records
Map
Nearby Homes
- 5606 Oakley Hill
- 1545 Dogwood Dr
- 5586 Shelton Creek Rd
- 5148 Lucy Averette Rd
- 2536 Enon Rd
- 24 Acres Bob Daniel Rd
- 6035 Mary Lee Dr
- 6079 Zachary Ln
- 2605 Joe Pruitt Rd
- 595 George Sherman Rd
- Tract 2b Watkins Rd
- 4551 Sugar Maple Rd
- 4148 Forest Ct
- 2071 Thad Carey Rd
- 6049 Mulberry Ln
- 2665 Bodie Currin Rd
- 6063 N Carolina 96
- 0 Old Roxboro Rd Unit 10027603
- 1664 Garrett Farm Rd
- 1658 Garrett Farm Rd
- 5518 Goochs Mill Rd
- 5536 Goochs Mill Rd
- 5540 Goochs Mill Rd
- 5539 Goochs Mill Rd
- 5539 Goochs Mill Rd
- 0 Gooch Mill Rd
- 1660 Us Highway 158
- 1613 Us Highway 158
- 1617 Us Highway 158
- 1617 Us Highway 158
- 1598 Us Highway 158
- 1598 Us Highway 158
- 5522 Goochs Mill Rd
- 5522 Goochs Mill Rd
- 1613 Tommie Daniel Rd
- 1599 Us Highway 158
- 1589 Us Highway 158
- 1635 Tommie Daniel Rd
- 1659 Us Highway 158
- 5581 Hebron Rd