5527 Preserve Point Flowery Branch, GA 30542
Estimated Value: $487,000 - $534,000
5
Beds
5
Baths
2,400
Sq Ft
$213/Sq Ft
Est. Value
About This Home
This home is located at 5527 Preserve Point, Flowery Branch, GA 30542 and is currently estimated at $511,708, approximately $213 per square foot. 5527 Preserve Point is a home located in Hall County with nearby schools including Spout Springs Elementary School, Cherokee Bluff Middle School, and Cherokee Bluff High School.
Ownership History
Date
Name
Owned For
Owner Type
Purchase Details
Closed on
Oct 8, 2020
Sold by
Haag Philip J
Bought by
Cantrell Jonathan Craig and Cantrell Michelle Truelove
Current Estimated Value
Home Financials for this Owner
Home Financials are based on the most recent Mortgage that was taken out on this home.
Original Mortgage
$250,000
Outstanding Balance
$221,956
Interest Rate
2.8%
Mortgage Type
New Conventional
Estimated Equity
$289,752
Purchase Details
Closed on
Aug 30, 2006
Sold by
White Horse At The Preserves L
Bought by
Haag Philip J and Haag Courtney E
Home Financials for this Owner
Home Financials are based on the most recent Mortgage that was taken out on this home.
Original Mortgage
$39,942
Interest Rate
6.73%
Mortgage Type
New Conventional
Purchase Details
Closed on
Jun 28, 2006
Sold by
Little River Homes Inc
Bought by
White Horse Homes I Llc
Create a Home Valuation Report for This Property
The Home Valuation Report is an in-depth analysis detailing your home's value as well as a comparison with similar homes in the area
Home Values in the Area
Average Home Value in this Area
Purchase History
| Date | Buyer | Sale Price | Title Company |
|---|---|---|---|
| Cantrell Jonathan Craig | $350,000 | -- | |
| Haag Philip J | $266,300 | -- | |
| White Horse Homes I Llc | $356,000 | -- |
Source: Public Records
Mortgage History
| Date | Status | Borrower | Loan Amount |
|---|---|---|---|
| Open | Cantrell Jonathan Craig | $250,000 | |
| Previous Owner | Haag Philip J | $39,942 | |
| Previous Owner | Haag Philip J | $213,024 |
Source: Public Records
Tax History Compared to Growth
Tax History
| Year | Tax Paid | Tax Assessment Tax Assessment Total Assessment is a certain percentage of the fair market value that is determined by local assessors to be the total taxable value of land and additions on the property. | Land | Improvement |
|---|---|---|---|---|
| 2024 | $5,033 | $196,400 | $28,840 | $167,560 |
| 2023 | $4,796 | $186,760 | $28,840 | $157,920 |
| 2022 | $4,266 | $158,680 | $28,080 | $130,600 |
| 2021 | $3,649 | $132,120 | $22,480 | $109,640 |
| 2020 | $3,261 | $115,960 | $15,240 | $100,720 |
| 2019 | $3,133 | $110,240 | $15,240 | $95,000 |
| 2018 | $3,152 | $107,440 | $15,720 | $91,720 |
| 2017 | $3,055 | $105,160 | $14,240 | $90,920 |
| 2016 | $2,717 | $109,560 | $12,520 | $97,040 |
| 2015 | $1,903 | $97,240 | $12,520 | $84,720 |
| 2014 | $1,903 | $65,008 | $10,000 | $55,008 |
Source: Public Records
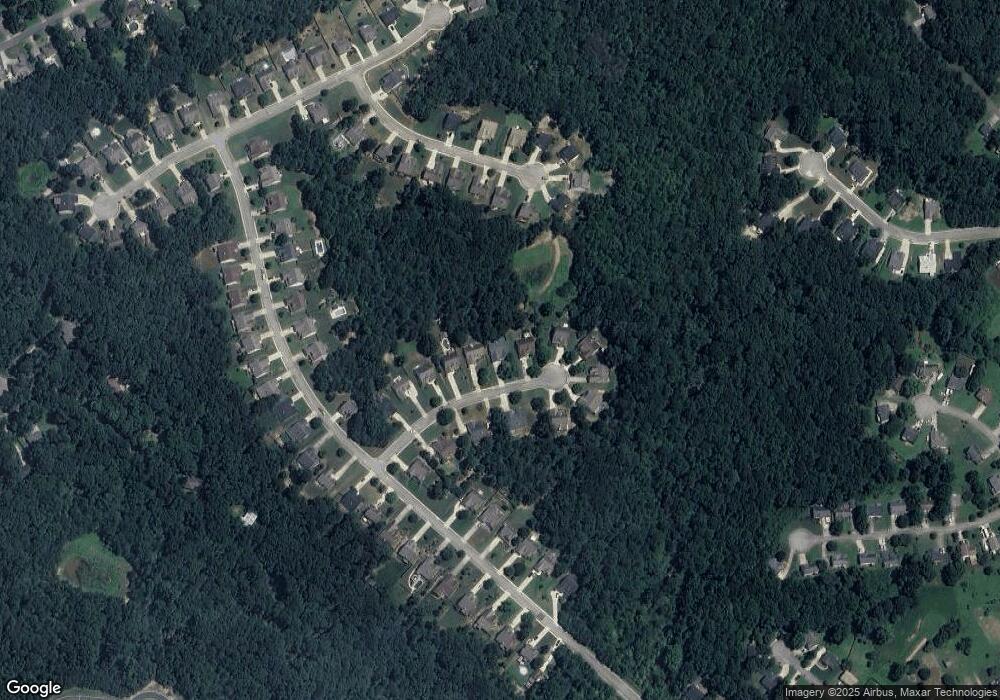
Map
Nearby Homes
- 5610 Wooded Valley Way
- 5641 Wooded Valley Way
- 5505 Riverchase Dr
- 5536 Rolling Mist Ct
- 5540 Rolling Mist Ct
- 5325 Highpoint Rd
- 6512 Shady Valley Dr
- 5306 Highpoint Rd
- 5157 Glen Forrest Dr
- 6315 Spout Springs Rd
- 5129 Glen Forrest Dr
- 6410 Crosscreek Ln
- 5526 Chestnut Creek Ln
- 6229 Ivy Springs Dr
- 5126 Cash Rd
- 6722 Blue Heron Way
- 6844 Golden Bud Ln
- 6535 Crosscreek Ln
- 5523 Preserve Point
- 5531 Preserve Point
- 5519 Preserve Point
- LOT 9 The Preserve
- 0 Lot 9 the Preserve Unit LOT 9 298757
- 5535 Preserve Point
- 5528 Preserve Point
- 5515 Preserve Point
- 5520 Preserve Point
- 0 Preserve Point Unit 8355836
- 0 Preserve Point Unit 8615028
- 0 Preserve Point Unit 7538885
- 0 Preserve Point Unit 8777934
- 0 Preserve Point Unit 7169287
- 5536 Preserve Point
- 5536 Preserve Point Unit 20
- 5540 Preserve Point
- 5539 Preserve Point
- 5512 Preserve Point
- 5544 Preserve Point