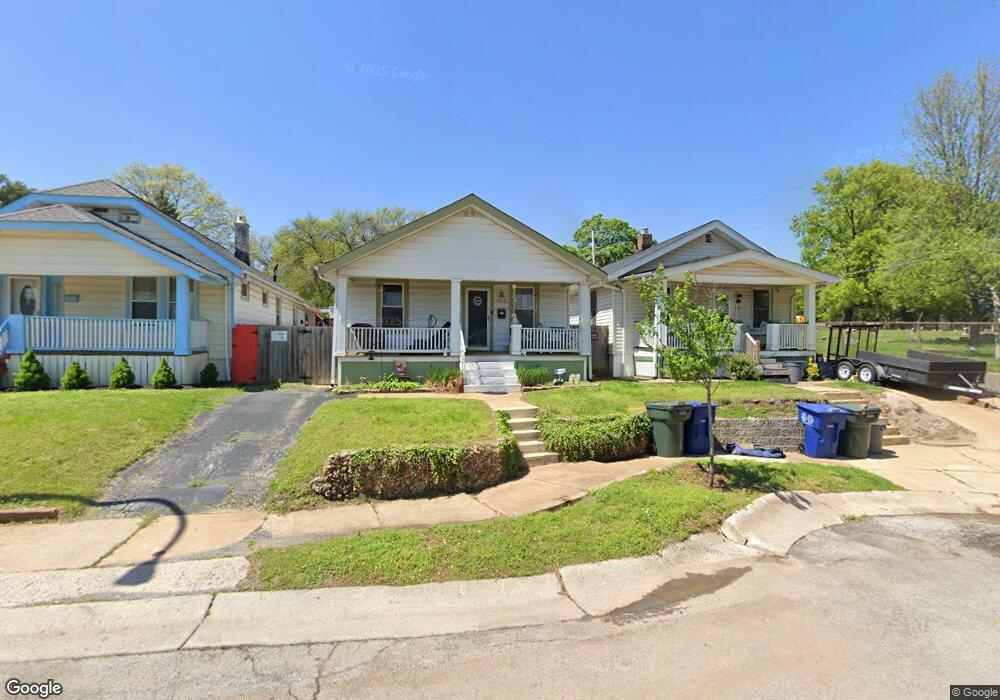
5529 Maze Place Saint Louis, MO 63116
Bevo Mill NeighborhoodEstimated Value: $148,000 - $213,000
--
Bed
2
Baths
1,344
Sq Ft
$126/Sq Ft
Est. Value
About This Home
This home is located at 5529 Maze Place, Saint Louis, MO 63116 and is currently estimated at $169,152, approximately $125 per square foot. 5529 Maze Place is a home located in St. Louis City with nearby schools including Woerner Elementary School, Long International Middle School, and Roosevelt High School.
Ownership History
Date
Name
Owned For
Owner Type
Purchase Details
Closed on
Jun 2, 2006
Sold by
Finan Casey D and Finan Casey E
Bought by
Hermann Julie
Current Estimated Value
Home Financials for this Owner
Home Financials are based on the most recent Mortgage that was taken out on this home.
Original Mortgage
$87,900
Outstanding Balance
$51,649
Interest Rate
6.56%
Mortgage Type
Fannie Mae Freddie Mac
Estimated Equity
$117,503
Purchase Details
Closed on
Jan 30, 2004
Sold by
Lampert Joseph R and Lampert Debra L
Bought by
Finan Casey D
Home Financials for this Owner
Home Financials are based on the most recent Mortgage that was taken out on this home.
Original Mortgage
$40,000
Interest Rate
5.12%
Mortgage Type
Purchase Money Mortgage
Purchase Details
Closed on
Mar 28, 2003
Sold by
Pace Gary L and Pace Colleen E
Bought by
Lampert Joseph R
Purchase Details
Closed on
Jun 5, 1997
Sold by
Federal Home Loan Mortgage Corporation
Bought by
Farrell Kevin P and Pace Gary L
Purchase Details
Closed on
May 8, 1997
Sold by
Mercantile Bank Of St Louis Natl Assn
Bought by
Federal Home Loan Mortgage Corporation
Purchase Details
Closed on
Apr 4, 1997
Sold by
Radloff Stuart J
Bought by
Mercantile Bank Na
Create a Home Valuation Report for This Property
The Home Valuation Report is an in-depth analysis detailing your home's value as well as a comparison with similar homes in the area
Home Values in the Area
Average Home Value in this Area
Purchase History
| Date | Buyer | Sale Price | Title Company |
|---|---|---|---|
| Hermann Julie | -- | None Available | |
| Finan Casey D | -- | -- | |
| Lampert Joseph R | -- | -- | |
| Farrell Kevin P | -- | -- | |
| Federal Home Loan Mortgage Corporation | -- | First American Title Ins Co | |
| Mercantile Bank Na | $34,000 | -- |
Source: Public Records
Mortgage History
| Date | Status | Borrower | Loan Amount |
|---|---|---|---|
| Open | Hermann Julie | $87,900 | |
| Previous Owner | Finan Casey D | $40,000 |
Source: Public Records
Tax History Compared to Growth
Tax History
| Year | Tax Paid | Tax Assessment Tax Assessment Total Assessment is a certain percentage of the fair market value that is determined by local assessors to be the total taxable value of land and additions on the property. | Land | Improvement |
|---|---|---|---|---|
| 2025 | $1,402 | $19,000 | $1,290 | $17,710 |
| 2024 | $1,335 | $16,420 | $1,290 | $15,130 |
| 2023 | $1,335 | $16,420 | $1,290 | $15,130 |
| 2022 | $1,251 | $14,800 | $1,290 | $13,510 |
| 2021 | $1,250 | $14,800 | $1,290 | $13,510 |
| 2020 | $1,122 | $13,360 | $1,290 | $12,070 |
| 2019 | $1,118 | $13,360 | $1,290 | $12,070 |
| 2018 | $933 | $10,750 | $1,290 | $9,460 |
| 2017 | $918 | $10,750 | $1,290 | $9,460 |
| 2016 | $885 | $10,220 | $1,290 | $8,930 |
| 2015 | $804 | $10,220 | $1,290 | $8,930 |
| 2014 | $799 | $10,220 | $1,290 | $8,930 |
| 2013 | -- | $10,160 | $1,290 | $8,870 |
Source: Public Records
Map
Nearby Homes
- 4009 Burgen Ave
- 3953 Eiler St
- 4010 Schiller Place
- 4028 Schiller Place
- 5632 Leona St
- 3922 Burgen Ave
- 3904 Walsh St
- 3831 Burgen Ave
- 5231 Steffens Ave
- 3824 Burgen Ave
- 5907 Leona St
- 4045 Walsh St
- 4226 Bates St
- 4109 Walsh St
- 4171 Eichelberger St
- 4163 Walsh St
- 5420 Dewey Ave
- 6116 Leona St
- 5207 Dewey Ave
- 5203 Dewey Ave
- 5527 Maze Place
- 5533 Maze Place
- 5537 Maze Place
- 5541 Maze Place
- 5545 Maze Place
- 5547 Maze Place
- 5528 Maze Place
- 5532 Maze Place
- 5524 Maze Place
- 5536 Maze Place
- 5540 Maze Place
- 5544 Maze Place
- 5533 Grant Place
- 5531 Grant Place
- 5537 Grant Place
- 5527 Grant Place
- 5539 Grant Place
- 5523 Grant Place
- 5543 Grant Place
- 5519 Grant Place