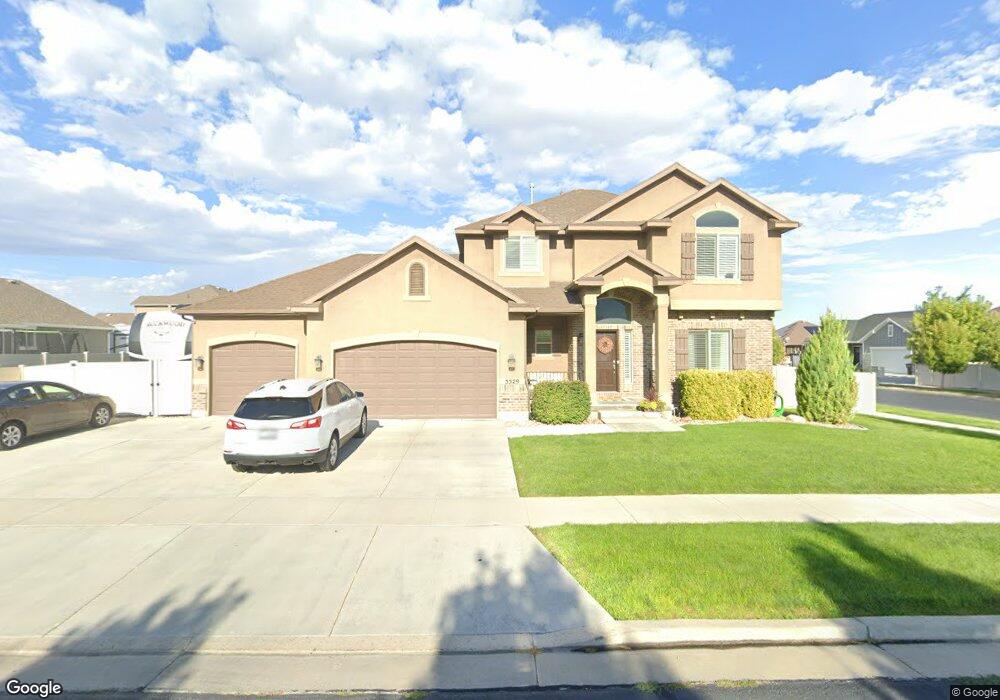
5529 N Shady Brook Ln Tooele, UT 84074
Estimated Value: $582,255 - $741,000
--
Bed
--
Bath
3,414
Sq Ft
$187/Sq Ft
Est. Value
About This Home
This home is located at 5529 N Shady Brook Ln, Tooele, UT 84074 and is currently estimated at $640,064, approximately $187 per square foot. 5529 N Shady Brook Ln is a home with nearby schools including Rose Springs Elementary School, Clarke N. Johnsen Junior High School, and Stansbury High School.
Ownership History
Date
Name
Owned For
Owner Type
Purchase Details
Closed on
Mar 12, 2015
Sold by
Symphony Group Llc
Bought by
Gull Justin R and Gull Shannonh I
Current Estimated Value
Home Financials for this Owner
Home Financials are based on the most recent Mortgage that was taken out on this home.
Original Mortgage
$310,083
Outstanding Balance
$235,904
Interest Rate
3.5%
Mortgage Type
FHA
Estimated Equity
$404,160
Purchase Details
Closed on
Oct 13, 2014
Sold by
Stansbury Sbl 2009 Llc
Bought by
Symphony Group Llc
Purchase Details
Closed on
Jul 30, 2009
Sold by
Shadybrook Lane Llc
Bought by
Stansbury Sbl 2009 Llc
Create a Home Valuation Report for This Property
The Home Valuation Report is an in-depth analysis detailing your home's value as well as a comparison with similar homes in the area
Home Values in the Area
Average Home Value in this Area
Purchase History
| Date | Buyer | Sale Price | Title Company |
|---|---|---|---|
| Gull Justin R | -- | Keystone Title Insurance Age | |
| Symphony Group Llc | -- | Keystone Title Insurance Age | |
| Symphony Group Llc | -- | None Available | |
| Stansbury Sbl 2009 Llc | -- | Bonneville Superior Title |
Source: Public Records
Mortgage History
| Date | Status | Borrower | Loan Amount |
|---|---|---|---|
| Open | Gull Justin R | $310,083 | |
| Closed | Symphony Group Llc | $0 |
Source: Public Records
Tax History Compared to Growth
Tax History
| Year | Tax Paid | Tax Assessment Tax Assessment Total Assessment is a certain percentage of the fair market value that is determined by local assessors to be the total taxable value of land and additions on the property. | Land | Improvement |
|---|---|---|---|---|
| 2025 | $4,516 | $570,808 | $175,200 | $395,608 |
| 2024 | $4,693 | $301,530 | $96,360 | $205,170 |
| 2023 | $4,693 | $312,477 | $97,680 | $214,797 |
| 2022 | $4,731 | $379,678 | $89,496 | $290,182 |
| 2021 | $3,683 | $244,109 | $70,521 | $173,588 |
| 2020 | $3,584 | $415,368 | $99,600 | $315,768 |
| 2019 | $3,377 | $384,899 | $99,600 | $285,299 |
| 2018 | $3,429 | $374,418 | $100,000 | $274,418 |
| 2017 | $3,172 | $366,425 | $100,000 | $266,425 |
| 2016 | $2,085 | $182,421 | $55,000 | $127,421 |
| 2015 | $2,085 | $130,862 | $0 | $0 |
| 2014 | -- | $100,000 | $0 | $0 |
Source: Public Records
Map
Nearby Homes
- 45 W Streams Edge Way
- 39 Strasbourg Ln
- 5584 N Gentle Breeze Ct
- 133 W Marigold Cir Unit 311
- 5454 Heather Way
- 5419 Heather Way
- 5531 Ponderosa Ln
- 5546 Ardennes Way
- 5502 Ardennes Way
- 107 Pebble Beach Dr
- 5675 Lanyard Ln
- 5718 Lanyard Ln
- 138 W Morning Glory Cir
- 198 Clermont Ln
- 62 Fairway Dr
- 5493 Lorraine Way
- 5246 Roma Ln
- 5258 Ponderosa Ln
- 137 Stern Ct
- 5212 Roma Ln
- 45 W Misty Brook Ln
- 30 W Streams Edge Way
- 46 W Streams Edge Way
- 5528 N Shady Brook Ln
- 5553 N Shady Brook Ln
- 44 W Misty Brook Ln
- 5544 N Shady Brook Ln
- 61 W Misty Brook Ln
- 5510 N Shady Brook Ln
- 60 W Streams Edge Way Unit 151
- 5554 N Gentle Breeze Ct
- 5491 N Shady Brook Ln
- 5491 N Shady Brook Ln Unit 117
- 5562 N Shady Brook Ln
- 5571 N Shady Brook Ln
- 5494 N Shady Brook Ln
- 77 W Misty Brook Ln
- 76 W Streams Edge Way
- 5572 N Gentle Breeze Ct
- 61 W Streams Edge Way