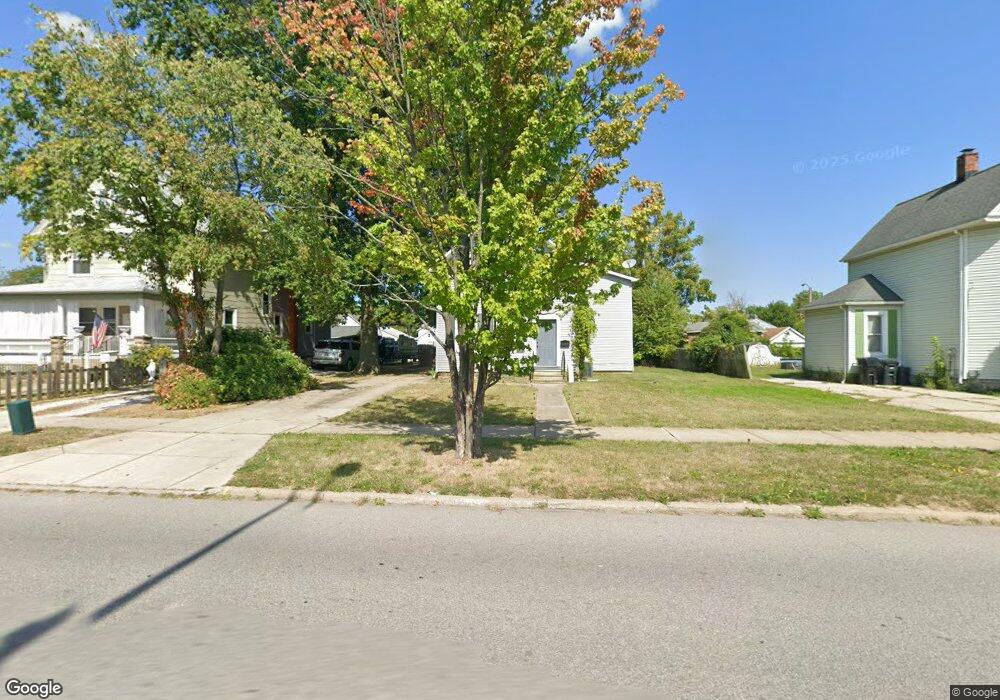
553 3rd St Elyria, OH 44035
Estimated Value: $115,000 - $173,000
3
Beds
2
Baths
1,704
Sq Ft
$81/Sq Ft
Est. Value
About This Home
This home is located at 553 3rd St, Elyria, OH 44035 and is currently estimated at $138,221, approximately $81 per square foot. 553 3rd St is a home located in Lorain County with nearby schools including Eastern Heights Middle School, Elyria High School, and St Mary Elementary School.
Ownership History
Date
Name
Owned For
Owner Type
Purchase Details
Closed on
Oct 1, 2020
Sold by
Wise Bradley J and Wise Bradley
Bought by
Mosley Darrell G
Current Estimated Value
Home Financials for this Owner
Home Financials are based on the most recent Mortgage that was taken out on this home.
Original Mortgage
$46,665
Outstanding Balance
$41,506
Interest Rate
2.9%
Mortgage Type
New Conventional
Estimated Equity
$96,715
Purchase Details
Closed on
Aug 28, 2007
Sold by
Us Bank Na
Bought by
Wise Bradley
Purchase Details
Closed on
Dec 21, 2006
Sold by
Burnsworth Michael and Burnsworth Rebecca
Bought by
Us Bank Na and Structured Asset Investment Loan Trust 2
Purchase Details
Closed on
May 13, 2005
Sold by
Davis Jason E
Bought by
Burnsworth Michael D and Burnsworth Rebecca L
Home Financials for this Owner
Home Financials are based on the most recent Mortgage that was taken out on this home.
Original Mortgage
$76,000
Interest Rate
8.25%
Mortgage Type
Fannie Mae Freddie Mac
Purchase Details
Closed on
Jan 26, 2005
Sold by
Bank One Na
Bought by
Davis Jason E
Create a Home Valuation Report for This Property
The Home Valuation Report is an in-depth analysis detailing your home's value as well as a comparison with similar homes in the area
Home Values in the Area
Average Home Value in this Area
Purchase History
| Date | Buyer | Sale Price | Title Company |
|---|---|---|---|
| Mosley Darrell G | $54,900 | None Available | |
| Wise Bradley | $33,500 | Prism Title & Closing Servic | |
| Us Bank Na | $42,000 | None Available | |
| Burnsworth Michael D | $95,000 | Multiple | |
| Davis Jason E | $25,000 | Resource Title Agency Inc |
Source: Public Records
Mortgage History
| Date | Status | Borrower | Loan Amount |
|---|---|---|---|
| Open | Mosley Darrell G | $46,665 | |
| Previous Owner | Burnsworth Michael D | $76,000 |
Source: Public Records
Tax History
| Year | Tax Paid | Tax Assessment Tax Assessment Total Assessment is a certain percentage of the fair market value that is determined by local assessors to be the total taxable value of land and additions on the property. | Land | Improvement |
|---|---|---|---|---|
| 2024 | $2,203 | $45,434 | $10,084 | $35,350 |
| 2023 | $1,722 | $30,839 | $4,431 | $26,408 |
| 2022 | $1,716 | $30,839 | $4,431 | $26,408 |
| 2021 | $1,720 | $30,839 | $4,431 | $26,408 |
| 2020 | $1,653 | $26,360 | $3,790 | $22,570 |
| 2019 | $1,643 | $26,360 | $3,790 | $22,570 |
| 2018 | $1,490 | $26,360 | $3,790 | $22,570 |
| 2017 | $1,334 | $20,480 | $3,720 | $16,760 |
| 2016 | $1,317 | $20,480 | $3,720 | $16,760 |
| 2015 | $1,236 | $20,480 | $3,720 | $16,760 |
| 2014 | $1,221 | $20,480 | $3,720 | $16,760 |
| 2013 | $1,211 | $20,480 | $3,720 | $16,760 |
Source: Public Records
Map
Nearby Homes
Your Personal Tour Guide
Ask me questions while you tour the home.