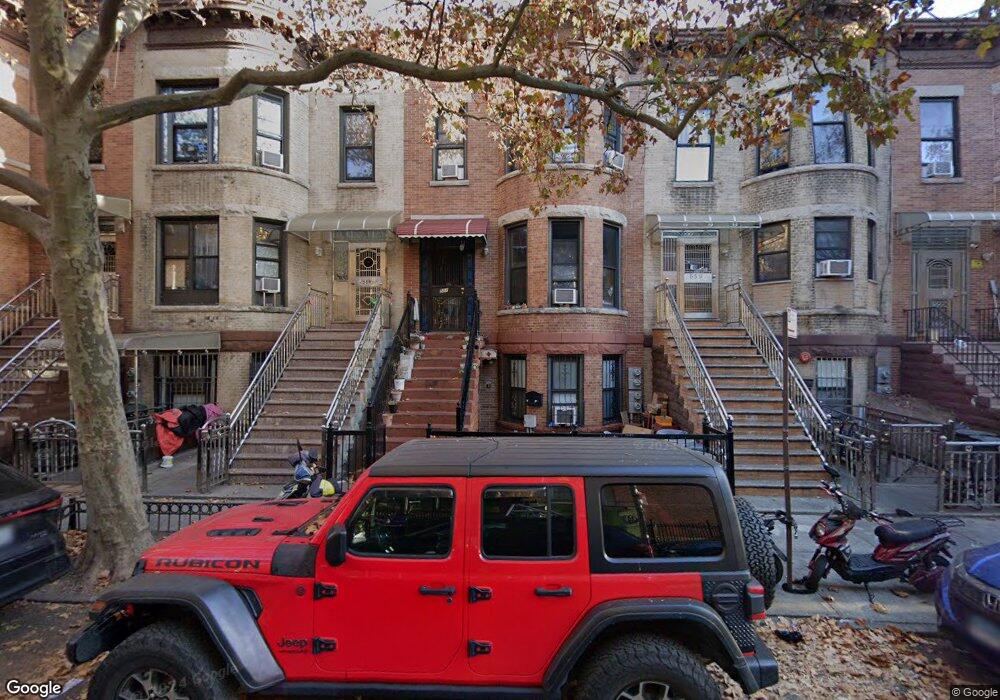
553 59th St Brooklyn, NY 11220
Sunset Park NeighborhoodEstimated Value: $1,475,000 - $1,849,000
Studio
--
Bath
3,180
Sq Ft
$529/Sq Ft
Est. Value
About This Home
This home is located at 553 59th St, Brooklyn, NY 11220 and is currently estimated at $1,680,767, approximately $528 per square foot. 553 59th St is a home located in Kings County with nearby schools including P.S. 506: The School of Journalism & Technology, IS 220 John J. Pershing, and Fort Hamilton High School.
Ownership History
Date
Name
Owned For
Owner Type
Purchase Details
Closed on
Sep 25, 2023
Sold by
Weng Nen Mei and Zheng Vincent
Bought by
Jiang Han and Zheng Vincent
Current Estimated Value
Purchase Details
Closed on
Mar 29, 2022
Sold by
Jiang Zhen Ru and Weng Nen Mei
Bought by
Weng Nen Mei and Zheng Vincent
Purchase Details
Closed on
Feb 2, 2012
Sold by
Hernandez Edwin
Bought by
Jiang Zhen Ru and Weng Nen Mei
Home Financials for this Owner
Home Financials are based on the most recent Mortgage that was taken out on this home.
Original Mortgage
$533,000
Interest Rate
3.88%
Mortgage Type
New Conventional
Create a Home Valuation Report for This Property
The Home Valuation Report is an in-depth analysis detailing your home's value as well as a comparison with similar homes in the area
Home Values in the Area
Average Home Value in this Area
Purchase History
| Date | Buyer | Sale Price | Title Company |
|---|---|---|---|
| Jiang Han | -- | -- | |
| Weng Nen Mei | -- | -- | |
| Jiang Zhen Ru | $960,000 | -- |
Source: Public Records
Mortgage History
| Date | Status | Borrower | Loan Amount |
|---|---|---|---|
| Previous Owner | Jiang Zhen Ru | $533,000 |
Source: Public Records
Tax History
| Year | Tax Paid | Tax Assessment Tax Assessment Total Assessment is a certain percentage of the fair market value that is determined by local assessors to be the total taxable value of land and additions on the property. | Land | Improvement |
|---|---|---|---|---|
| 2025 | $8,792 | $94,920 | $31,140 | $63,780 |
| 2024 | $8,792 | $105,840 | $31,140 | $74,700 |
| 2023 | $8,371 | $105,300 | $31,140 | $74,160 |
| 2022 | $7,740 | $97,080 | $31,140 | $65,940 |
| 2021 | $8,166 | $91,680 | $31,140 | $60,540 |
| 2020 | $4,027 | $87,480 | $31,140 | $56,340 |
| 2019 | $7,582 | $87,480 | $31,140 | $56,340 |
| 2018 | $6,942 | $35,515 | $18,000 | $17,515 |
| 2017 | $6,531 | $33,508 | $16,786 | $16,722 |
| 2016 | $6,389 | $33,508 | $14,553 | $18,955 |
| 2015 | $3,813 | $33,253 | $18,829 | $14,424 |
| 2014 | $3,813 | $31,371 | $20,202 | $11,169 |
Source: Public Records
Map
Nearby Homes
Your Personal Tour Guide
Ask me questions while you tour the home.