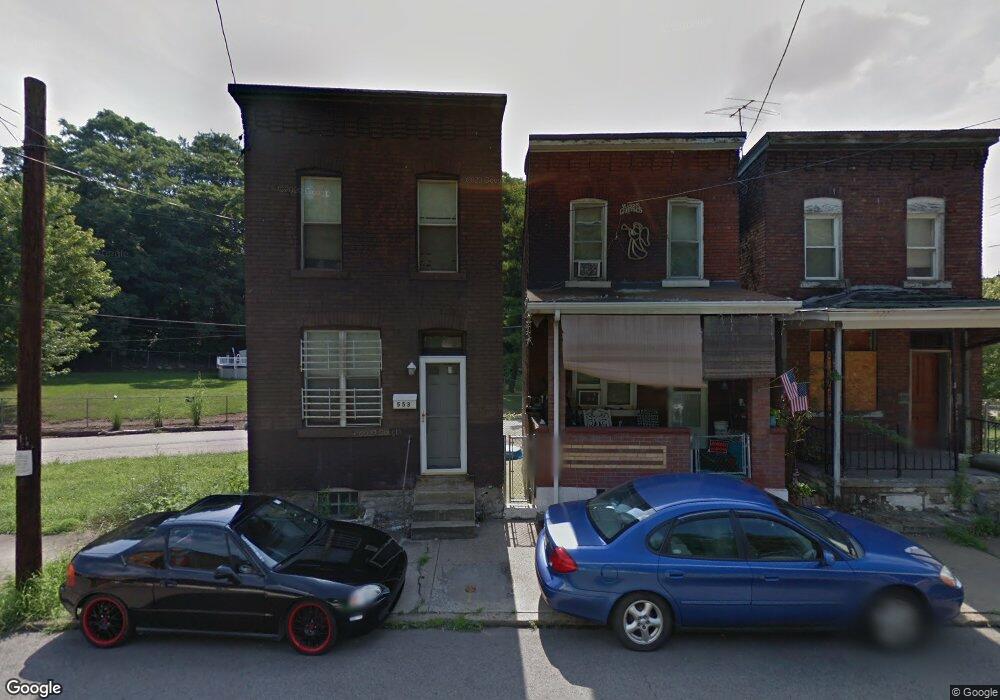
553 Corey Ave Braddock, PA 15104
Estimated Value: $33,000 - $70,836
2
Beds
1
Bath
1,024
Sq Ft
$51/Sq Ft
Est. Value
About This Home
This home is located at 553 Corey Ave, Braddock, PA 15104 and is currently estimated at $51,959, approximately $50 per square foot. 553 Corey Ave is a home located in Allegheny County with nearby schools including Woodland Hills Senior High School, The Western Pennsylvania School for the Deaf, and Braddock Hills High School.
Ownership History
Date
Name
Owned For
Owner Type
Purchase Details
Closed on
Jun 7, 2023
Sold by
M 2 & M 3 Capital Funding L L C
Bought by
Houzeofwaxx
Current Estimated Value
Purchase Details
Closed on
May 11, 2023
Sold by
M2 & M3 Capital Funding Llc
Bought by
Houzeofwaxx
Purchase Details
Closed on
Sep 15, 2020
Sold by
Kellington Joseph C and Kellington Theresa V
Bought by
Kellington Joseph C
Purchase Details
Closed on
Oct 8, 2019
Sold by
Dry Creek Land Lp
Bought by
M2 & M3 Capital Funding Llc
Purchase Details
Closed on
Nov 2, 2007
Sold by
Mcmillan Michael
Bought by
Dry Creek Land
Create a Home Valuation Report for This Property
The Home Valuation Report is an in-depth analysis detailing your home's value as well as a comparison with similar homes in the area
Home Values in the Area
Average Home Value in this Area
Purchase History
| Date | Buyer | Sale Price | Title Company |
|---|---|---|---|
| Houzeofwaxx | $10,250 | -- | |
| Houzeofwaxx | $10,250 | -- | |
| Houzeofwaxx | $10,250 | -- | |
| Kellington Joseph C | -- | Attorney | |
| M2 & M3 Capital Funding Llc | $1,000 | None Available | |
| Dry Creek Land | $14,000 | -- |
Source: Public Records
Tax History
| Year | Tax Paid | Tax Assessment Tax Assessment Total Assessment is a certain percentage of the fair market value that is determined by local assessors to be the total taxable value of land and additions on the property. | Land | Improvement |
|---|---|---|---|---|
| 2025 | $745 | $16,600 | $2,300 | $14,300 |
| 2024 | $745 | $16,600 | $2,300 | $14,300 |
| 2023 | $753 | $16,600 | $2,300 | $14,300 |
| 2022 | $753 | $16,600 | $2,300 | $14,300 |
| 2021 | $79 | $16,600 | $2,300 | $14,300 |
| 2020 | $739 | $16,600 | $2,300 | $14,300 |
| 2019 | $726 | $16,600 | $2,300 | $14,300 |
| 2017 | $709 | $16,600 | $2,300 | $14,300 |
Source: Public Records
Map
Nearby Homes
Your Personal Tour Guide
Ask me questions while you tour the home.