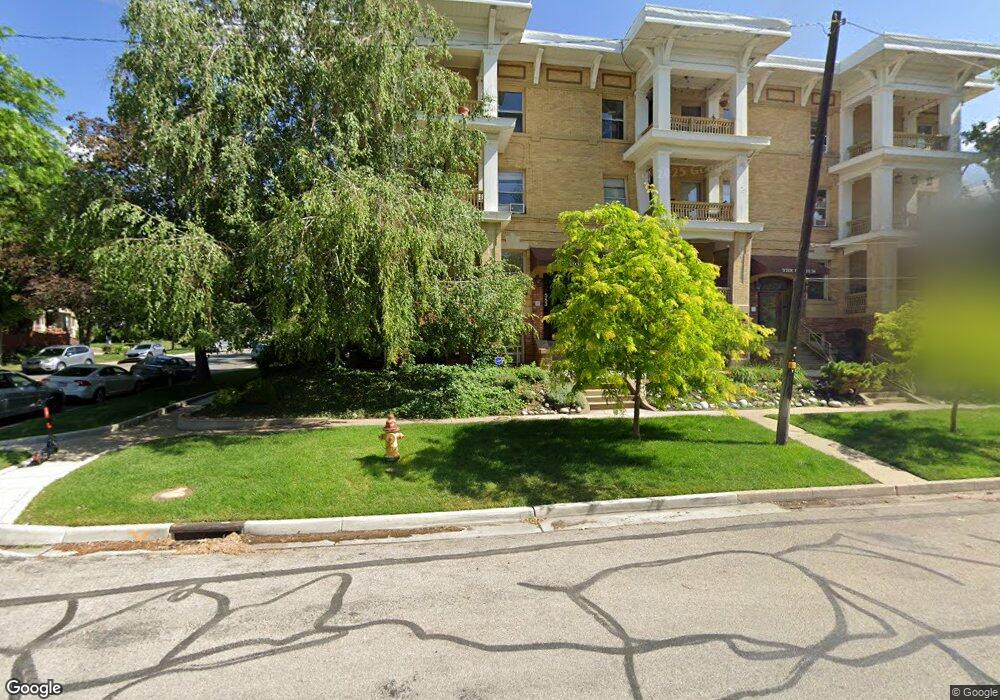
553 E 1st Ave Unit 11 Salt Lake City, UT 84103
The Avenues NeighborhoodEstimated Value: $335,041 - $426,000
1
Bed
1
Bath
1,096
Sq Ft
$347/Sq Ft
Est. Value
About This Home
This home is located at 553 E 1st Ave Unit 11, Salt Lake City, UT 84103 and is currently estimated at $380,760, approximately $347 per square foot. 553 E 1st Ave Unit 11 is a home located in Salt Lake County with nearby schools including Wasatch Elementary School, West High, and Open Classroom.
Ownership History
Date
Name
Owned For
Owner Type
Purchase Details
Closed on
May 18, 2004
Sold by
Watson Julie D
Bought by
Havey Michael T
Current Estimated Value
Home Financials for this Owner
Home Financials are based on the most recent Mortgage that was taken out on this home.
Original Mortgage
$121,198
Outstanding Balance
$58,260
Interest Rate
5.86%
Mortgage Type
FHA
Estimated Equity
$322,500
Purchase Details
Closed on
Mar 8, 2002
Sold by
Wildfoerster Douglas V
Bought by
Watson Julie D
Home Financials for this Owner
Home Financials are based on the most recent Mortgage that was taken out on this home.
Original Mortgage
$118,750
Interest Rate
6.99%
Purchase Details
Closed on
Aug 18, 1999
Sold by
Pell Douglas L and Pell Olene
Bought by
Wildfoerster Douglas
Home Financials for this Owner
Home Financials are based on the most recent Mortgage that was taken out on this home.
Original Mortgage
$75,000
Interest Rate
7.63%
Purchase Details
Closed on
May 4, 1999
Sold by
Christensen Olene and Pell Olene
Bought by
Pell Douglas L and Pell Olene
Create a Home Valuation Report for This Property
The Home Valuation Report is an in-depth analysis detailing your home's value as well as a comparison with similar homes in the area
Home Values in the Area
Average Home Value in this Area
Purchase History
| Date | Buyer | Sale Price | Title Company |
|---|---|---|---|
| Havey Michael T | -- | Paramount Title | |
| Watson Julie D | -- | Surety Title | |
| Wildfoerster Douglas | -- | Associated Title | |
| Pell Douglas L | -- | Associated Title |
Source: Public Records
Mortgage History
| Date | Status | Borrower | Loan Amount |
|---|---|---|---|
| Open | Havey Michael T | $121,198 | |
| Previous Owner | Watson Julie D | $118,750 | |
| Previous Owner | Wildfoerster Douglas | $75,000 |
Source: Public Records
Tax History Compared to Growth
Tax History
| Year | Tax Paid | Tax Assessment Tax Assessment Total Assessment is a certain percentage of the fair market value that is determined by local assessors to be the total taxable value of land and additions on the property. | Land | Improvement |
|---|---|---|---|---|
| 2025 | -- | $315,600 | $94,700 | $220,900 |
| 2024 | -- | $314,500 | $94,300 | $220,200 |
| 2023 | $2,061 | $309,400 | $92,800 | $216,600 |
| 2022 | $2,061 | $355,700 | $106,700 | $249,000 |
| 2021 | $1,859 | $290,400 | $87,100 | $203,300 |
| 2020 | $1,824 | $271,200 | $81,300 | $189,900 |
| 2019 | $1,778 | $248,700 | $74,600 | $174,100 |
| 2018 | $1,662 | $226,400 | $67,900 | $158,500 |
| 2017 | $1,608 | $205,200 | $61,500 | $143,700 |
| 2016 | $1,453 | $176,100 | $52,800 | $123,300 |
| 2015 | $1,460 | $167,700 | $50,300 | $117,400 |
| 2014 | $1,457 | $166,000 | $49,800 | $116,200 |
Source: Public Records
Map
Nearby Homes
- 557 E 1st Ave Unit 12
- 636 E 2nd Ave
- 64 F St
- 123 G St
- 560 E South Temple Unit 201
- 560 E South Temple Unit C101
- 560 E South Temple Unit 704
- 560 E South Temple Unit 802
- 560 E South Temple Unit 302
- 679 E 2nd Ave
- 423 E 1st Ave
- 555 E 100 S Unit 106
- 555 E 100 S Unit 206
- 555 E 100 S Unit 105
- 777 E South Temple Unit 15D
- 777 E South Temple Unit 13A
- 777 E South Temple Unit 10D
- 777 E South Temple Unit 10d
- 777 E South Temple Unit 3J
- 777 E South Temple Unit 11F
- 553 E 1st Ave Unit 9
- 553 E 1st Ave Unit 7
- 553 E 1st Ave Unit 1
- 553 E 1st Ave Unit 5
- 553 E 1st Ave Unit 4
- 553 1st Ave Unit 6
- 553 1st Ave Unit 10
- 553 1st Ave Unit 5
- 553 1st Ave Unit 8
- 553 1st Ave Unit 2
- 553 1st Ave Unit 3
- 553 1st Ave Unit 4
- 553 1st Ave Unit 1
- 553 1st Ave Unit 12
- 553 1st Ave Unit 11
- 553 1st Ave Unit 9
- 553 1st Ave Unit 7
- 557 E 1st Ave Unit 11
- 557 E 1st Ave Unit 10
- 557 E 1st Avenue Ave N Unit 10