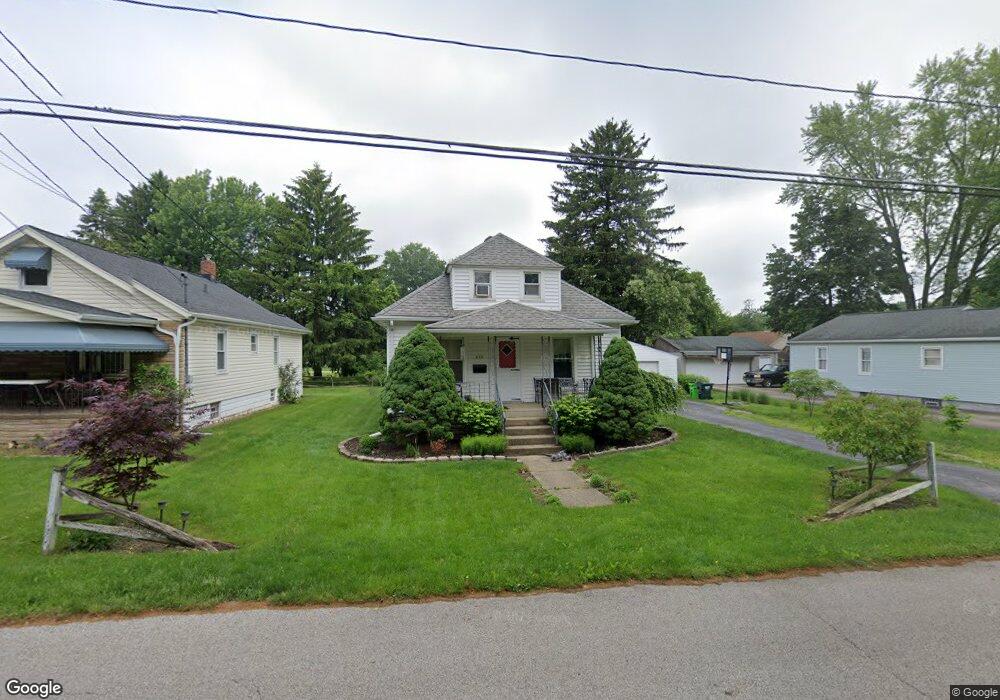
553 E Huston St Barberton, OH 44203
East Barberton NeighborhoodEstimated Value: $132,000 - $172,000
3
Beds
2
Baths
864
Sq Ft
$175/Sq Ft
Est. Value
About This Home
This home is located at 553 E Huston St, Barberton, OH 44203 and is currently estimated at $151,347, approximately $175 per square foot. 553 E Huston St is a home located in Summit County with nearby schools including Barberton Intermediate School 3-5, Barberton Middle School, and Barberton High School.
Ownership History
Date
Name
Owned For
Owner Type
Purchase Details
Closed on
Dec 18, 2014
Sold by
Thrasher Michael L and Thrasher Angela S
Bought by
Richardson Robert M
Current Estimated Value
Home Financials for this Owner
Home Financials are based on the most recent Mortgage that was taken out on this home.
Original Mortgage
$70,483
Outstanding Balance
$54,089
Interest Rate
3.97%
Mortgage Type
VA
Estimated Equity
$97,258
Purchase Details
Closed on
Feb 22, 2012
Sold by
Cusher John A
Bought by
Thrasher Michael L and Thrasher Angela S
Home Financials for this Owner
Home Financials are based on the most recent Mortgage that was taken out on this home.
Original Mortgage
$44,000
Interest Rate
3.87%
Mortgage Type
New Conventional
Purchase Details
Closed on
Jun 2, 2010
Sold by
Estate Of Anna E Cusher
Bought by
Cusher John A
Create a Home Valuation Report for This Property
The Home Valuation Report is an in-depth analysis detailing your home's value as well as a comparison with similar homes in the area
Home Values in the Area
Average Home Value in this Area
Purchase History
| Date | Buyer | Sale Price | Title Company |
|---|---|---|---|
| Richardson Robert M | $69,000 | American Land Title Affiliat | |
| Thrasher Michael L | $55,000 | Attorney | |
| Cusher John A | -- | Attorney |
Source: Public Records
Mortgage History
| Date | Status | Borrower | Loan Amount |
|---|---|---|---|
| Open | Richardson Robert M | $70,483 | |
| Previous Owner | Thrasher Michael L | $44,000 |
Source: Public Records
Tax History Compared to Growth
Tax History
| Year | Tax Paid | Tax Assessment Tax Assessment Total Assessment is a certain percentage of the fair market value that is determined by local assessors to be the total taxable value of land and additions on the property. | Land | Improvement |
|---|---|---|---|---|
| 2025 | $2,199 | $40,894 | $10,773 | $30,121 |
| 2024 | $2,199 | $40,894 | $10,773 | $30,121 |
| 2023 | $2,199 | $40,894 | $10,773 | $30,121 |
| 2022 | $1,786 | $28,490 | $7,329 | $21,161 |
| 2021 | $1,685 | $28,490 | $7,329 | $21,161 |
| 2020 | $1,749 | $28,490 | $7,330 | $21,160 |
| 2019 | $1,661 | $24,430 | $6,600 | $17,830 |
| 2018 | $1,638 | $24,430 | $6,600 | $17,830 |
| 2017 | $1,558 | $24,430 | $6,600 | $17,830 |
| 2016 | $1,562 | $24,430 | $6,600 | $17,830 |
| 2015 | $1,558 | $24,430 | $6,600 | $17,830 |
| 2014 | $1,325 | $20,880 | $4,930 | $15,950 |
| 2013 | $1,282 | $20,950 | $4,930 | $16,020 |
Source: Public Records
Map
Nearby Homes
- 653 Washington Ave
- 261 E State St
- 412 Grandview Ave
- 320 Lincoln Ave Unit 322
- 414 E Baird Ave
- 477 Robinson Ave
- 334 E Tuscarawas Ave
- 0 Wooster Rd N
- 613 Wooster Rd N
- 327 Robinson Ave
- 44 W Summit St
- 1110 Mansion Dr
- 46 Brown St
- 442 Wooster Rd N
- 251 Slate Ridge Dr
- 901 Robinson Ave
- 713 E State St
- 588 Austin Dr
- 1356 Carnegie Ave
- 861 Wisteria Dr
- 553 E Huston St
- 561 E Huston St
- 549 E Huston St
- 569 E Huston St
- 560 Washington Ave
- 554 Washington Ave
- 556 E Huston St
- 560 E Huston St
- 568 Washington Ave
- 550 E Huston St
- 570 E Huston St
- 539 E Huston St
- 579 E Huston St
- 546 E Huston St
- 531 E Huston St
- 540 Washington Ave
- 542 E Huston St
- 576 E Huston St
- 578 Washington Ave
- 584 E Huston St