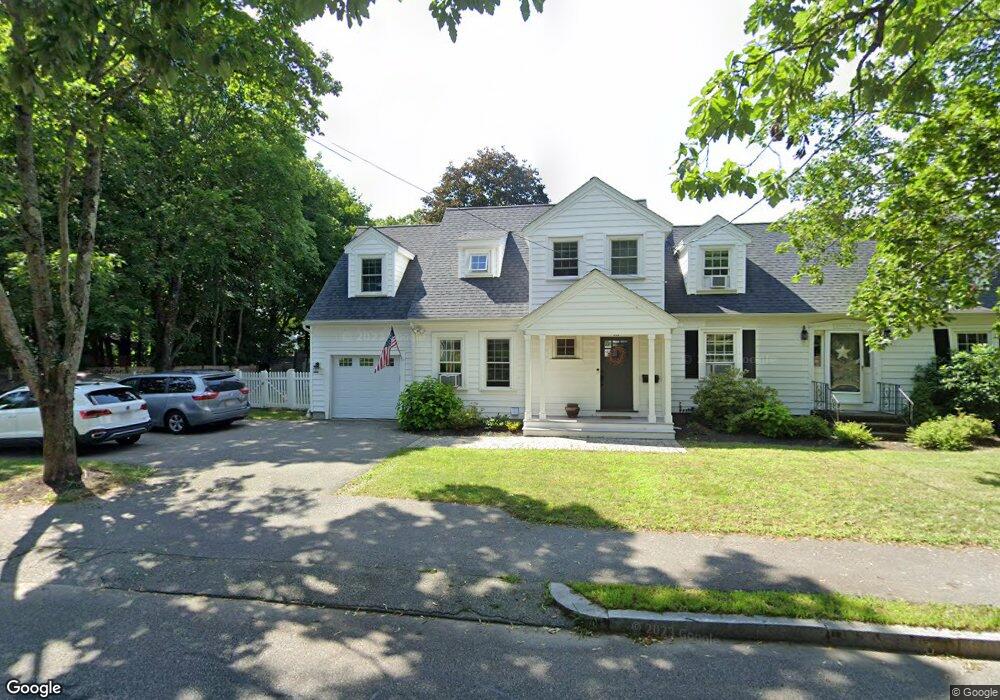
553 Franklin St Reading, MA 01867
Estimated Value: $857,000 - $1,185,077
2
Beds
3
Baths
1,629
Sq Ft
$651/Sq Ft
Est. Value
About This Home
This home is located at 553 Franklin St, Reading, MA 01867 and is currently estimated at $1,061,269, approximately $651 per square foot. 553 Franklin St is a home located in Middlesex County with nearby schools including Wood End Elementary School, Arthur W. Coolidge Middle School, and Reading Memorial High School.
Ownership History
Date
Name
Owned For
Owner Type
Purchase Details
Closed on
Aug 1, 2014
Sold by
Gellot Yann B and Gellot Yann
Bought by
Gellot Ft and Gellot
Current Estimated Value
Purchase Details
Closed on
Jun 26, 2001
Sold by
Verrier Peter F and Verrier Monette D
Bought by
Gellott Yann and Gellott Sophie
Home Financials for this Owner
Home Financials are based on the most recent Mortgage that was taken out on this home.
Original Mortgage
$275,000
Interest Rate
7.09%
Mortgage Type
Purchase Money Mortgage
Purchase Details
Closed on
May 1, 1996
Sold by
Burns Michael and Tocco-Burns Laurie
Bought by
Verrier Peter F and Dugas Monette J
Purchase Details
Closed on
Jul 29, 1991
Sold by
Mcpartlin Gertrude Est
Bought by
Burns Michael and Tocco-Burns Laurie
Create a Home Valuation Report for This Property
The Home Valuation Report is an in-depth analysis detailing your home's value as well as a comparison with similar homes in the area
Home Values in the Area
Average Home Value in this Area
Purchase History
| Date | Buyer | Sale Price | Title Company |
|---|---|---|---|
| Gellot Ft | -- | -- | |
| Gellott Yann | $355,000 | -- | |
| Verrier Peter F | $218,000 | -- | |
| Burns Michael | $165,000 | -- |
Source: Public Records
Mortgage History
| Date | Status | Borrower | Loan Amount |
|---|---|---|---|
| Previous Owner | Burns Michael | $200,000 | |
| Previous Owner | Burns Michael | $275,000 | |
| Previous Owner | Burns Michael | $188,300 |
Source: Public Records
Tax History
| Year | Tax Paid | Tax Assessment Tax Assessment Total Assessment is a certain percentage of the fair market value that is determined by local assessors to be the total taxable value of land and additions on the property. | Land | Improvement |
|---|---|---|---|---|
| 2025 | $11,257 | $988,300 | $473,200 | $515,100 |
| 2024 | $11,232 | $958,400 | $458,900 | $499,500 |
| 2023 | $10,510 | $834,800 | $399,700 | $435,100 |
| 2022 | $9,982 | $748,800 | $358,500 | $390,300 |
| 2021 | $5,684 | $695,000 | $344,100 | $350,900 |
| 2020 | $9,503 | $681,200 | $337,300 | $343,900 |
| 2019 | $9,232 | $648,800 | $321,200 | $327,600 |
| 2018 | $16,316 | $597,600 | $300,000 | $297,600 |
| 2017 | $8,015 | $571,300 | $286,800 | $284,500 |
| 2016 | $7,604 | $524,400 | $273,000 | $251,400 |
| 2015 | $7,124 | $484,600 | $252,300 | $232,300 |
| 2014 | $6,903 | $468,300 | $243,800 | $224,500 |
Source: Public Records
Map
Nearby Homes
- 150 Grove St
- 99 Grove St
- 119 Van Norden Rd
- 50 Forest St
- 2 Inwood Dr Unit 1005
- 17 Courtyard Place Unit 17
- 44 Grandview Rd
- 16 Briarwood Ave
- 30 Taylor Dr Unit 3011
- 68 Sanborn Ln
- 584 Woburn St
- 27 Audubon Rd
- 203 Lowell St Unit 316
- 203 Lowell St Unit 218
- 203 Lowell St Unit 120
- 18 Talbot Ln Unit 18
- 101 King St Unit 101
- 16 Munroe Ave
- 32 Granger Ave
- 5 Washington St Unit D4
- 10 Meadow Brook Ln
- 558 Franklin St
- 552 Franklin St
- 12 Meadow Brook Ln
- 565 Franklin St
- 545 Franklin St
- 249 Grove St
- 9 Meadow Brook Ln
- 566 Franklin St
- 255 Grove St
- 16 Meadow Brook Ln
- 23 Meadow Brook Ln
- 544 Franklin St
- 31 Larch Ln
- 34 Larch Ln
- 240 Grove St
- 570 Franklin St
- 259 Grove St
- 27 Meadow Brook Ln
- 529 Franklin St
Your Personal Tour Guide
Ask me questions while you tour the home.