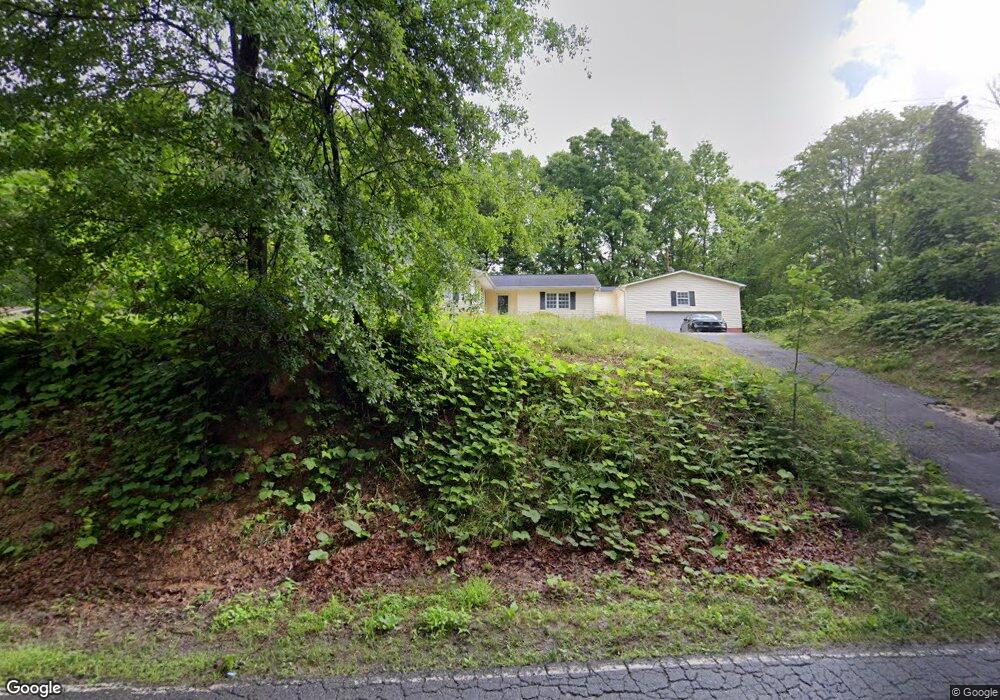
553 Hunts Bridge Rd Easley, SC 29640
Dacusville NeighborhoodEstimated Value: $191,038 - $285,000
2
Beds
1
Bath
946
Sq Ft
$256/Sq Ft
Est. Value
About This Home
This home is located at 553 Hunts Bridge Rd, Easley, SC 29640 and is currently estimated at $242,010, approximately $255 per square foot. 553 Hunts Bridge Rd is a home located in Pickens County with nearby schools including Dacusville Elementary School, Dacusville Middle School, and Pickens High School.
Ownership History
Date
Name
Owned For
Owner Type
Purchase Details
Closed on
Jul 19, 2021
Sold by
Baldwin Dillon L
Bought by
Coronel Jose
Current Estimated Value
Home Financials for this Owner
Home Financials are based on the most recent Mortgage that was taken out on this home.
Original Mortgage
$174,600
Outstanding Balance
$158,422
Interest Rate
2.9%
Mortgage Type
New Conventional
Estimated Equity
$83,588
Purchase Details
Closed on
Jun 25, 2014
Sold by
Davis Jereimah T and Davis Bethany
Bought by
Baldwin Dillon L
Home Financials for this Owner
Home Financials are based on the most recent Mortgage that was taken out on this home.
Original Mortgage
$86,632
Interest Rate
4.23%
Mortgage Type
New Conventional
Purchase Details
Closed on
Jun 7, 2011
Sold by
Citifinancial Inc
Bought by
Davis Jeremiah T and Wilson Diana C
Home Financials for this Owner
Home Financials are based on the most recent Mortgage that was taken out on this home.
Original Mortgage
$53,550
Interest Rate
4.62%
Purchase Details
Closed on
Mar 11, 2011
Sold by
Martin William E and Martin Gail S
Bought by
Citifinancial Inc
Create a Home Valuation Report for This Property
The Home Valuation Report is an in-depth analysis detailing your home's value as well as a comparison with similar homes in the area
Home Values in the Area
Average Home Value in this Area
Purchase History
| Date | Buyer | Sale Price | Title Company |
|---|---|---|---|
| Coronel Jose | $180,000 | None Available | |
| Baldwin Dillon L | $84,900 | -- | |
| Davis Jeremiah T | $63,000 | -- | |
| Citifinancial Inc | $500 | -- |
Source: Public Records
Mortgage History
| Date | Status | Borrower | Loan Amount |
|---|---|---|---|
| Open | Coronel Jose | $174,600 | |
| Previous Owner | Baldwin Dillon L | $86,632 | |
| Previous Owner | Davis Jeremiah T | $53,550 |
Source: Public Records
Tax History Compared to Growth
Tax History
| Year | Tax Paid | Tax Assessment Tax Assessment Total Assessment is a certain percentage of the fair market value that is determined by local assessors to be the total taxable value of land and additions on the property. | Land | Improvement |
|---|---|---|---|---|
| 2024 | $2,180 | $9,070 | $1,200 | $7,870 |
| 2023 | $2,180 | $9,070 | $1,200 | $7,870 |
| 2022 | $2,187 | $9,070 | $1,200 | $7,870 |
| 2021 | $444 | $3,560 | $800 | $2,760 |
| 2020 | $426 | $3,564 | $800 | $2,764 |
| 2019 | $433 | $3,560 | $800 | $2,760 |
| 2018 | $403 | $3,100 | $720 | $2,380 |
| 2017 | $393 | $3,100 | $720 | $2,380 |
| 2015 | $374 | $3,100 | $0 | $0 |
| 2008 | -- | $3,160 | $720 | $2,440 |
Source: Public Records
Map
Nearby Homes
- 709 Hunts Bridge Rd
- 144 N Martin Rd
- 530 Old Hunts Bridge Rd
- 149 Elbert Clark Dr
- 3352 Earls Bridge Rd
- 0 Diwa Dr
- 322 Faye Cir
- 1527 Pace Bridge Rd
- 0 Rutledge Lake Rd Unit 24187063
- 0 Rutledge Lake Rd Unit 20285832
- 0 Rutledge Lake Rd Unit SPN322261
- 0 Rutledge Lake Rd Unit 1553391
- 202 Montview Cir
- 1025 Old Dacusville Rd
- 54 Woodall Rd
- 813 Hester Store Rd
- 404 Thornbury Ridge
- 222 Montview Cir
- 208 Anchor Rd
- 0 Blackberry Valley Rd
- 549 Hunts Bridge Rd
- 521 Hunts Bridge Rd
- 101 Henline Dr
- 565 Hunts Bridge Rd
- 548 Hunts Bridge Rd
- 507 Hunts Bridge Rd
- 582 Hunts Bridge Rd
- 110 Woodworkers Ln
- 118 Sandy Ln
- 588 Hunts Bridge Rd
- 127 Woodworkers Ln
- 106 Sandy Ln
- 00 Spring Point Dr
- 167 Spring Point Dr
- 135 L A Ln
- 162 Spring Point Dr
- 705 Hunts Bridge Rd
- 166 Spring Point Dr
- 189 Spring Point Dr
- 199 Spring Point Dr