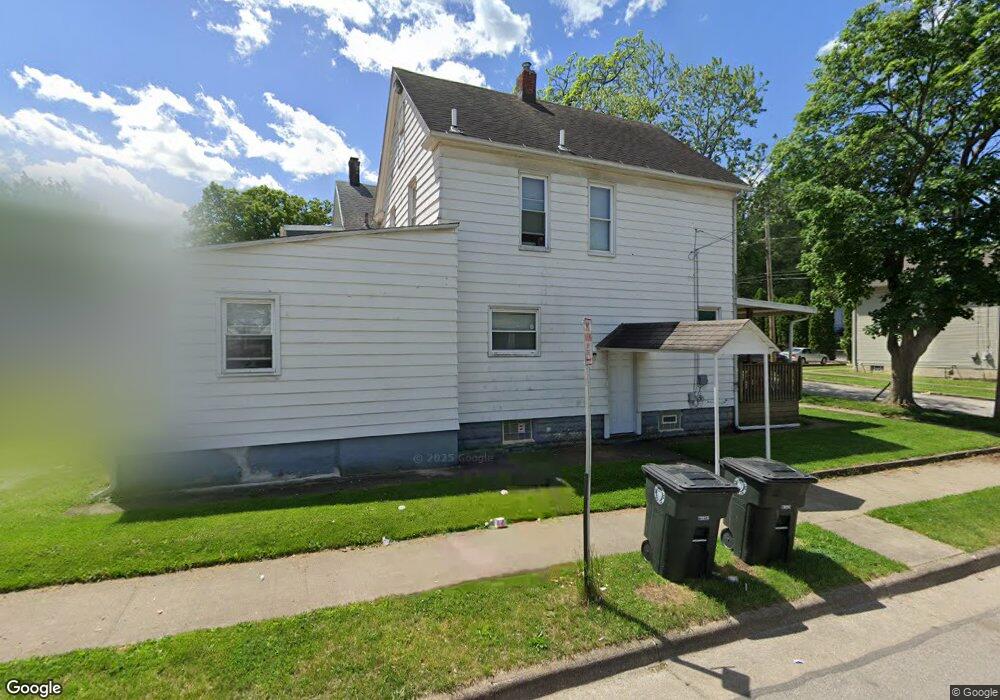
553 Kling St Akron, OH 44311
Downtown Akron NeighborhoodEstimated Value: $103,000 - $129,000
4
Beds
2
Baths
1,535
Sq Ft
$72/Sq Ft
Est. Value
About This Home
This home is located at 553 Kling St, Akron, OH 44311 and is currently estimated at $111,191, approximately $72 per square foot. 553 Kling St is a home located in Summit County with nearby schools including North High School, Main Preparatory Academy, and Case Preparatory Academy.
Ownership History
Date
Name
Owned For
Owner Type
Purchase Details
Closed on
Aug 6, 2014
Sold by
Perduk Tricia L
Bought by
Fairchild Capital Llc
Current Estimated Value
Purchase Details
Closed on
Jul 29, 2014
Sold by
Perduk David C
Bought by
Perduk Tricia L
Purchase Details
Closed on
Oct 29, 2003
Sold by
Indymac Bank Fsb
Bought by
Perduk David C
Purchase Details
Closed on
Jun 3, 2003
Sold by
Fannie Mae
Bought by
Indymac Bank Fsb
Purchase Details
Closed on
May 22, 2003
Sold by
Evon Friend
Bought by
Federal National Mortgage Association
Purchase Details
Closed on
May 25, 2001
Sold by
Pac Properties Ltd
Bought by
Friend Evon
Home Financials for this Owner
Home Financials are based on the most recent Mortgage that was taken out on this home.
Original Mortgage
$52,000
Interest Rate
7.07%
Mortgage Type
Seller Take Back
Purchase Details
Closed on
Jun 4, 1998
Sold by
Bergdorf William
Bought by
Pac Properties Ltd
Create a Home Valuation Report for This Property
The Home Valuation Report is an in-depth analysis detailing your home's value as well as a comparison with similar homes in the area
Home Values in the Area
Average Home Value in this Area
Purchase History
| Date | Buyer | Sale Price | Title Company |
|---|---|---|---|
| Fairchild Capital Llc | -- | None Available | |
| Perduk Tricia L | -- | None Available | |
| Perduk David C | $57,500 | American Certified Title | |
| Indymac Bank Fsb | $44,000 | American Certified Title | |
| Federal National Mortgage Association | $44,000 | -- | |
| Friend Evon | $52,000 | Cresent Title Agency | |
| Friend Evon | $52,000 | Cresent Title Agency | |
| Pac Properties Ltd | $16,700 | -- |
Source: Public Records
Mortgage History
| Date | Status | Borrower | Loan Amount |
|---|---|---|---|
| Previous Owner | Friend Evon | $52,000 | |
| Previous Owner | Friend Evon | $56,000 |
Source: Public Records
Tax History Compared to Growth
Tax History
| Year | Tax Paid | Tax Assessment Tax Assessment Total Assessment is a certain percentage of the fair market value that is determined by local assessors to be the total taxable value of land and additions on the property. | Land | Improvement |
|---|---|---|---|---|
| 2025 | $1,991 | $34,433 | $6,391 | $28,042 |
| 2024 | $1,991 | $34,433 | $6,391 | $28,042 |
| 2023 | $1,991 | $34,433 | $6,391 | $28,042 |
| 2022 | $1,736 | $23,255 | $4,232 | $19,023 |
| 2021 | $1,738 | $23,255 | $4,232 | $19,023 |
| 2020 | $1,714 | $23,250 | $4,230 | $19,020 |
| 2019 | $1,629 | $19,950 | $4,230 | $15,720 |
| 2018 | $1,609 | $19,950 | $4,230 | $15,720 |
| 2017 | $1,453 | $19,950 | $4,230 | $15,720 |
| 2016 | $1,454 | $17,470 | $4,230 | $13,240 |
| 2015 | $1,453 | $17,470 | $4,230 | $13,240 |
| 2014 | $1,442 | $17,470 | $4,230 | $13,240 |
| 2013 | $1,775 | $22,570 | $4,230 | $18,340 |
Source: Public Records
Map
Nearby Homes
- 380 Cross St Unit 382
- 531 Allyn St Unit 533
- 442 E Thornton St
- 370 E Thornton St
- 319 Sterling Ct
- 590 and 596 Sumner St
- 463 Allyn St
- 495 Beacon St
- 633 Brown St
- 628, 634 & 636 Sumner St Unit 6 units
- 274 Wheeler St
- 298 Sumner Ct
- 498 Gage St
- 269 Wheeler St
- 504 Sumner St
- 433 Allyn St
- 634 Spicer St
- 687 Allyn St
- 281 E Thornton St
- 386 E Voris St