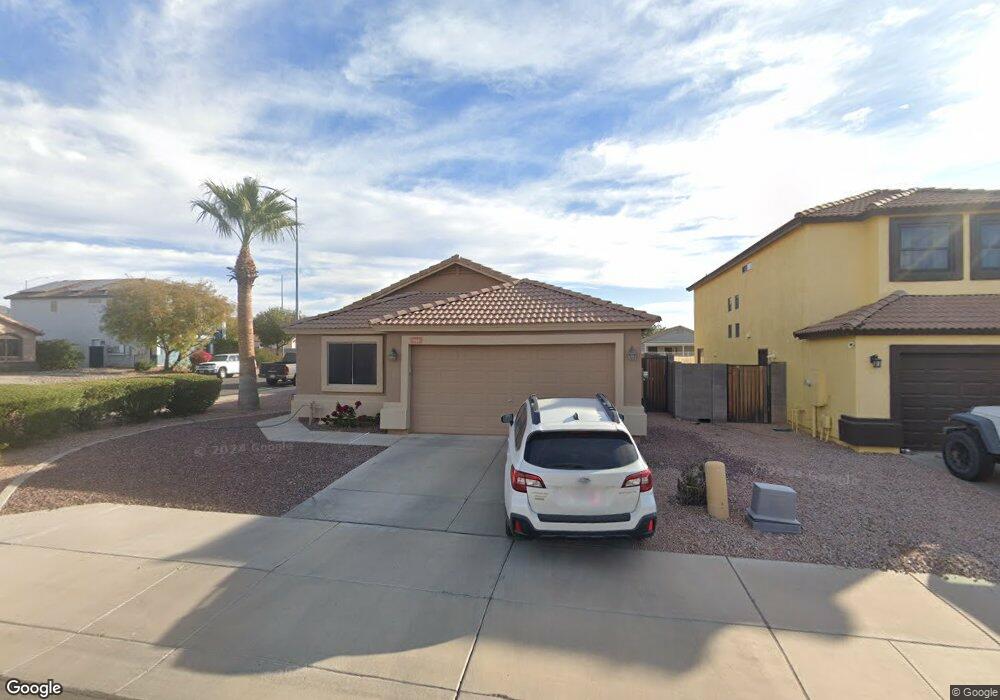
553 N 105th Place Mesa, AZ 85207
Northeast Mesa NeighborhoodEstimated Value: $363,338 - $474,000
--
Bed
2
Baths
1,648
Sq Ft
$262/Sq Ft
Est. Value
About This Home
This home is located at 553 N 105th Place, Mesa, AZ 85207 and is currently estimated at $432,085, approximately $262 per square foot. 553 N 105th Place is a home located in Maricopa County with nearby schools including Sousa Elementary School, Franklin at Brimhall Elementary School, and Franklin West Elementary School.
Ownership History
Date
Name
Owned For
Owner Type
Purchase Details
Closed on
May 5, 2023
Sold by
Stallings Family Trust
Bought by
Hurley-Gonzalez Jordyn Nicol and Pachuca Donovan Gonzalez
Current Estimated Value
Purchase Details
Closed on
Nov 29, 2018
Sold by
Stallings David A and Stallings Linda K
Bought by
Stallings David A and Stallings Linda K
Purchase Details
Closed on
Aug 4, 2005
Sold by
Stallings David
Bought by
Stallings David and Stallings Linda
Home Financials for this Owner
Home Financials are based on the most recent Mortgage that was taken out on this home.
Original Mortgage
$183,770
Interest Rate
5.46%
Mortgage Type
New Conventional
Purchase Details
Closed on
Aug 23, 2001
Sold by
Sunstone Homes Inc
Bought by
Stallings David
Home Financials for this Owner
Home Financials are based on the most recent Mortgage that was taken out on this home.
Original Mortgage
$136,416
Interest Rate
7.09%
Mortgage Type
FHA
Create a Home Valuation Report for This Property
The Home Valuation Report is an in-depth analysis detailing your home's value as well as a comparison with similar homes in the area
Home Values in the Area
Average Home Value in this Area
Purchase History
| Date | Buyer | Sale Price | Title Company |
|---|---|---|---|
| Hurley-Gonzalez Jordyn Nicol | -- | None Listed On Document | |
| Stallings David A | -- | None Available | |
| Stallings David | -- | -- | |
| Stallings David | $138,607 | Security Title Agency |
Source: Public Records
Mortgage History
| Date | Status | Borrower | Loan Amount |
|---|---|---|---|
| Previous Owner | Stallings David | $183,770 | |
| Previous Owner | Stallings David | $136,416 |
Source: Public Records
Tax History Compared to Growth
Tax History
| Year | Tax Paid | Tax Assessment Tax Assessment Total Assessment is a certain percentage of the fair market value that is determined by local assessors to be the total taxable value of land and additions on the property. | Land | Improvement |
|---|---|---|---|---|
| 2025 | $1,334 | $15,823 | -- | -- |
| 2024 | $1,330 | $15,069 | -- | -- |
| 2023 | $1,330 | $31,300 | $6,260 | $25,040 |
| 2022 | $1,287 | $23,970 | $4,790 | $19,180 |
| 2021 | $1,285 | $22,550 | $4,510 | $18,040 |
| 2020 | $1,267 | $20,820 | $4,160 | $16,660 |
| 2019 | $1,331 | $18,770 | $3,750 | $15,020 |
| 2018 | $1,318 | $16,750 | $3,350 | $13,400 |
| 2017 | $1,294 | $15,720 | $3,140 | $12,580 |
| 2016 | $1,325 | $14,910 | $2,980 | $11,930 |
| 2015 | $1,239 | $13,900 | $2,780 | $11,120 |
Source: Public Records
Map
Nearby Homes
- 10544 E Baltimore St
- 10530 E Baltimore St
- 658 N Merrill Rd
- 10534 E Butte St
- 10443 E Billings St
- 612 N Signal Butte Rd
- 333 N 102nd Place
- 345 N Signal Butte Rd Unit 23
- 10558 E Boise St
- 604 N 101st Place
- 10434 E Albany St
- 10662 E Ensenada St
- 920 N 104th St
- 415 W Fremont Pass
- 10282 S Dutchman Dr
- 10274 S Dutchman Dr
- 10294 S Dutchman Dr
- 10277 S Dutchman Dr
- 10297 S Dutchman Dr
- 389 W Fremont Pass
- 547 N 105th Place
- 541 N 105th Place
- 10532 E Contessa St
- 10540 E Contessa St
- 10526 E Contessa St
- 535 N 105th Place
- 552 N 105th Place
- 554 N Canfield
- 546 N 105th Place
- 540 N 105th Place
- 558 N 105th Place
- 10520 E Contessa St
- 542 N Canfield
- 529 N 105th Place
- 10546 E Contessa St
- 534 N 105th Place
- 536 N Canfield
- 523 N 105th Place
- 528 N 105th Place
- 10552 E Contessa St