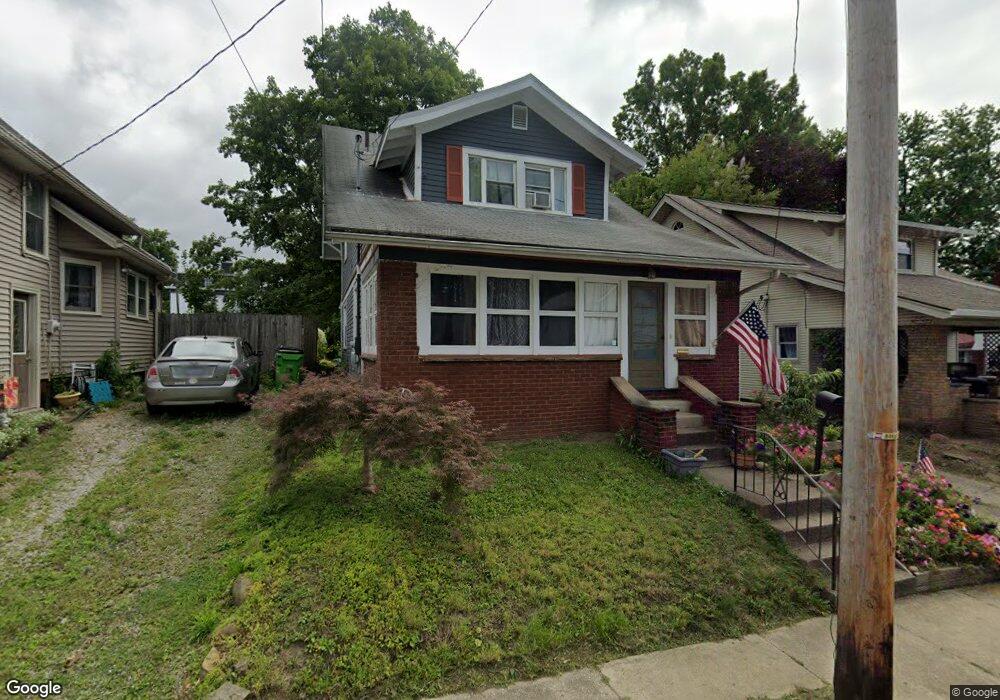
553 N Walnut St Wooster, OH 44691
Estimated Value: $142,000 - $179,000
3
Beds
2
Baths
1,120
Sq Ft
$147/Sq Ft
Est. Value
About This Home
This home is located at 553 N Walnut St, Wooster, OH 44691 and is currently estimated at $164,441, approximately $146 per square foot. 553 N Walnut St is a home located in Wayne County with nearby schools including Cornerstone Elementary School, Edgewood Middle School, and Wooster High School.
Ownership History
Date
Name
Owned For
Owner Type
Purchase Details
Closed on
Jun 26, 2019
Sold by
Chamberlin Colby M and Chamberlin Christa L
Bought by
Walter Stacey E and Aber Helen A
Current Estimated Value
Home Financials for this Owner
Home Financials are based on the most recent Mortgage that was taken out on this home.
Original Mortgage
$97,375
Outstanding Balance
$85,622
Interest Rate
4%
Mortgage Type
New Conventional
Estimated Equity
$78,819
Purchase Details
Closed on
Jan 17, 2012
Sold by
Reynolds Kathleen A and Crites Kathelen A
Bought by
Chamberlin Colby M and Chamberlin Christa L
Home Financials for this Owner
Home Financials are based on the most recent Mortgage that was taken out on this home.
Original Mortgage
$70,174
Interest Rate
3.87%
Mortgage Type
FHA
Purchase Details
Closed on
Jan 30, 1997
Sold by
Mcclure Douglas E
Bought by
Reynolds Kathleen A
Home Financials for this Owner
Home Financials are based on the most recent Mortgage that was taken out on this home.
Original Mortgage
$56,070
Interest Rate
7.81%
Mortgage Type
FHA
Purchase Details
Closed on
Feb 22, 1989
Sold by
Knepp Jack W and Knepp Beth A
Bought by
Mcclure Douglas E and Mcclure Carol
Create a Home Valuation Report for This Property
The Home Valuation Report is an in-depth analysis detailing your home's value as well as a comparison with similar homes in the area
Home Values in the Area
Average Home Value in this Area
Purchase History
| Date | Buyer | Sale Price | Title Company |
|---|---|---|---|
| Walter Stacey E | $102,500 | Southern Title | |
| Chamberlin Colby M | $72,000 | Service First | |
| Reynolds Kathleen A | $56,100 | -- | |
| Mcclure Douglas E | $45,000 | -- |
Source: Public Records
Mortgage History
| Date | Status | Borrower | Loan Amount |
|---|---|---|---|
| Open | Walter Stacey E | $97,375 | |
| Previous Owner | Chamberlin Colby M | $70,174 | |
| Previous Owner | Reynolds Kathleen A | $56,070 |
Source: Public Records
Tax History Compared to Growth
Tax History
| Year | Tax Paid | Tax Assessment Tax Assessment Total Assessment is a certain percentage of the fair market value that is determined by local assessors to be the total taxable value of land and additions on the property. | Land | Improvement |
|---|---|---|---|---|
| 2024 | $1,724 | $41,530 | $7,920 | $33,610 |
| 2023 | $1,724 | $41,530 | $7,920 | $33,610 |
| 2022 | $1,643 | $31,460 | $6,000 | $25,460 |
| 2021 | $1,694 | $31,460 | $6,000 | $25,460 |
| 2020 | $1,607 | $31,460 | $6,000 | $25,460 |
| 2019 | $1,372 | $25,790 | $5,970 | $19,820 |
| 2018 | $1,376 | $25,790 | $5,970 | $19,820 |
| 2017 | $1,385 | $25,790 | $5,970 | $19,820 |
| 2016 | $1,429 | $24,800 | $5,740 | $19,060 |
| 2015 | $1,403 | $24,800 | $5,740 | $19,060 |
| 2014 | $1,403 | $24,800 | $5,740 | $19,060 |
| 2013 | $1,398 | $24,380 | $5,760 | $18,620 |
Source: Public Records
Map
Nearby Homes
- 537 N Grant St
- 450 N Grant St
- 406 N Walnut St
- 534 N Buckeye St
- 423 N Market St
- 143 Park Ave
- 412 Emerick St
- 323 N Grant St
- 227 N Walnut St
- 229 N Walnut St
- 329 E Bowman St
- 657 N Bever St
- 429 Woodland Ave
- 349 W North St
- 900 Quinby Ave
- 336 Spring St
- 554 Nold Ave
- 1117 Quinby Ave
- 1123 Quinby Ave
- 548 Spring St
- 553 N Walnut St
- 553 N Walnut St
- 553 N Walnut St
- 557 N Walnut St
- 549 N Walnut St
- 567 N Walnut St
- 573 N Walnut St
- 554 N Walnut St
- 537 N Walnut St
- 548 N Walnut St
- 144 W Bowman St
- 540 N Walnut St
- 531 N Walnut St
- 579 N Walnut St
- 572 N Walnut St
- 536 N Walnut St
- 561 N Grant St
- 569 N Grant St
- 559 N Grant St
- 138 W Bowman St