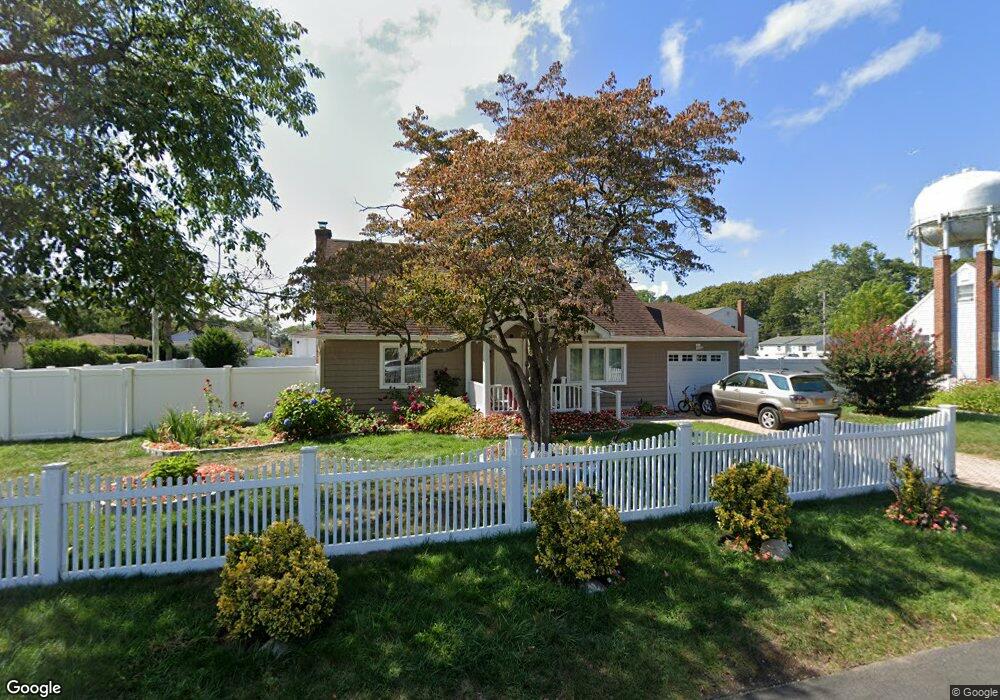
553 Prospect St Copiague, NY 11726
Estimated Value: $578,000 - $633,000
--
Bed
--
Bath
1,476
Sq Ft
$413/Sq Ft
Est. Value
About This Home
This home is located at 553 Prospect St, Copiague, NY 11726 and is currently estimated at $609,451, approximately $412 per square foot. 553 Prospect St is a home located in Suffolk County with nearby schools including Copiague Middle School, Walter G O Connell Copiague High School, and Copiague Christian Academy.
Ownership History
Date
Name
Owned For
Owner Type
Purchase Details
Closed on
Mar 15, 2021
Sold by
Moriches 168 Corp
Bought by
Torrez-Nunez Anthony and Rivas-Detorrez Stephania
Current Estimated Value
Purchase Details
Closed on
Jan 22, 2020
Sold by
Dearing Rosemarie and Brown Geneva
Bought by
Moriches 168 Corp
Home Financials for this Owner
Home Financials are based on the most recent Mortgage that was taken out on this home.
Original Mortgage
$196,200
Interest Rate
3.72%
Mortgage Type
New Conventional
Create a Home Valuation Report for This Property
The Home Valuation Report is an in-depth analysis detailing your home's value as well as a comparison with similar homes in the area
Home Values in the Area
Average Home Value in this Area
Purchase History
| Date | Buyer | Sale Price | Title Company |
|---|---|---|---|
| Torrez-Nunez Anthony | $478,000 | None Available | |
| Moriches 168 Corp | -- | None Available |
Source: Public Records
Mortgage History
| Date | Status | Borrower | Loan Amount |
|---|---|---|---|
| Previous Owner | Moriches 168 Corp | $196,200 |
Source: Public Records
Tax History Compared to Growth
Tax History
| Year | Tax Paid | Tax Assessment Tax Assessment Total Assessment is a certain percentage of the fair market value that is determined by local assessors to be the total taxable value of land and additions on the property. | Land | Improvement |
|---|---|---|---|---|
| 2024 | $10,229 | $2,880 | $300 | $2,580 |
| 2023 | $10,229 | $2,880 | $300 | $2,580 |
| 2022 | $7,290 | $2,880 | $300 | $2,580 |
| 2021 | $7,290 | $2,880 | $300 | $2,580 |
| 2020 | $15,067 | $2,880 | $300 | $2,580 |
| 2019 | $15,067 | $0 | $0 | $0 |
| 2018 | $7,270 | $2,880 | $300 | $2,580 |
| 2017 | $7,270 | $2,880 | $300 | $2,580 |
| 2016 | $7,200 | $2,880 | $300 | $2,580 |
| 2015 | -- | $2,880 | $300 | $2,580 |
| 2014 | -- | $2,880 | $300 | $2,580 |
Source: Public Records
Map
Nearby Homes