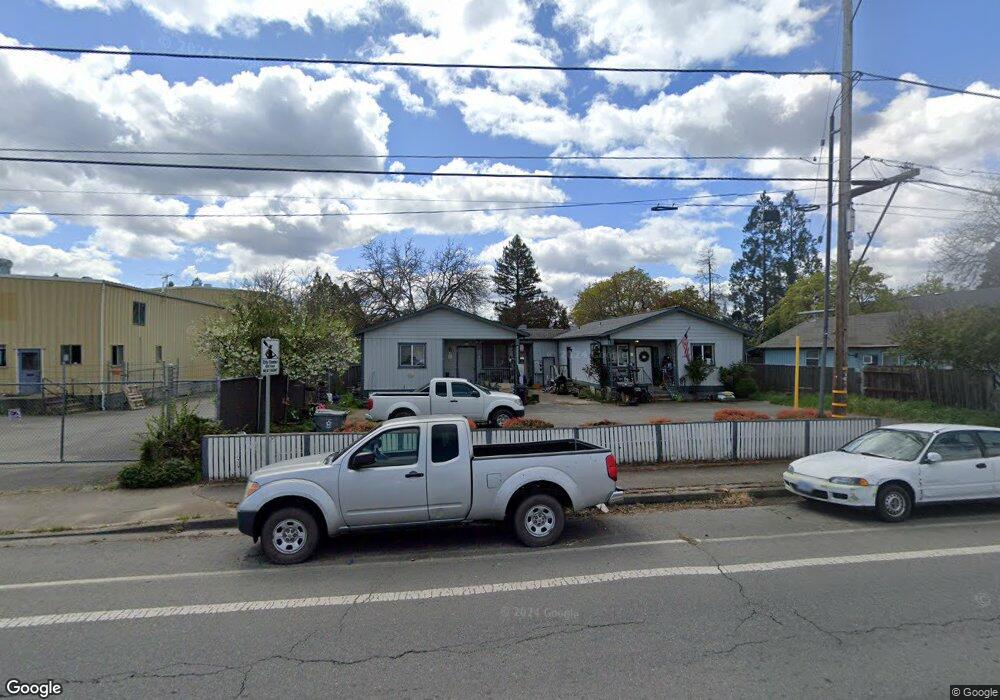
553 SW G St Grants Pass, OR 97526
Estimated Value: $425,893 - $447,000
6
Beds
4
Baths
2,104
Sq Ft
$207/Sq Ft
Est. Value
About This Home
This home is located at 553 SW G St, Grants Pass, OR 97526 and is currently estimated at $436,447, approximately $207 per square foot. 553 SW G St is a home located in Josephine County with nearby schools including Riverside Elementary School, North Middle School, and Grants Pass High School.
Ownership History
Date
Name
Owned For
Owner Type
Purchase Details
Closed on
Sep 19, 2005
Sold by
Mcdonald Ray D and Mcdonald Christine
Bought by
Delvaglio Peter R and Delvaglio Amanda S
Current Estimated Value
Home Financials for this Owner
Home Financials are based on the most recent Mortgage that was taken out on this home.
Original Mortgage
$138,000
Outstanding Balance
$73,191
Interest Rate
5.81%
Mortgage Type
Fannie Mae Freddie Mac
Estimated Equity
$363,256
Purchase Details
Closed on
Apr 9, 1981
Sold by
Rubin Andrew M
Bought by
Martin Gary and Martin Margie Lee
Create a Home Valuation Report for This Property
The Home Valuation Report is an in-depth analysis detailing your home's value as well as a comparison with similar homes in the area
Home Values in the Area
Average Home Value in this Area
Purchase History
| Date | Buyer | Sale Price | Title Company |
|---|---|---|---|
| Delvaglio Peter R | $295,900 | First American | |
| Martin Gary | $90,000 | Multiple |
Source: Public Records
Mortgage History
| Date | Status | Borrower | Loan Amount |
|---|---|---|---|
| Open | Delvaglio Peter R | $138,000 |
Source: Public Records
Tax History Compared to Growth
Tax History
| Year | Tax Paid | Tax Assessment Tax Assessment Total Assessment is a certain percentage of the fair market value that is determined by local assessors to be the total taxable value of land and additions on the property. | Land | Improvement |
|---|---|---|---|---|
| 2025 | $3,209 | $247,080 | -- | -- |
| 2024 | $3,209 | $239,890 | -- | -- |
| 2023 | $3,022 | $232,910 | $0 | $0 |
| 2022 | $3,037 | $226,130 | -- | -- |
| 2021 | $2,852 | $219,550 | $0 | $0 |
| 2020 | $2,770 | $213,160 | $0 | $0 |
| 2019 | $2,690 | $206,960 | $0 | $0 |
| 2018 | $2,737 | $200,940 | $0 | $0 |
| 2017 | $2,717 | $195,090 | $0 | $0 |
| 2016 | $2,314 | $189,380 | $0 | $0 |
| 2015 | $2,306 | $189,410 | $0 | $0 |
| 2014 | $2,275 | $185,210 | $0 | $0 |
Source: Public Records
Map
Nearby Homes