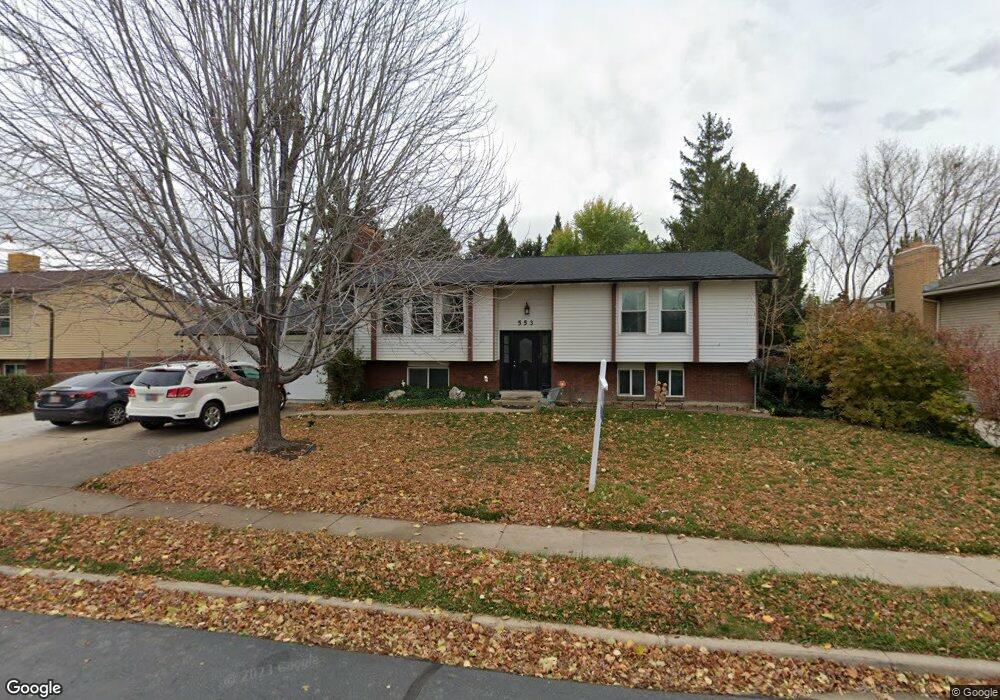
553 W 2125 N West Bountiful, UT 84087
Estimated Value: $531,000 - $562,261
5
Beds
2
Baths
2,599
Sq Ft
$209/Sq Ft
Est. Value
About This Home
This home is located at 553 W 2125 N, West Bountiful, UT 84087 and is currently estimated at $543,315, approximately $209 per square foot. 553 W 2125 N is a home located in Davis County with nearby schools including West Bountiful Elementary School, Bountiful Junior High School, and Viewmont High School.
Ownership History
Date
Name
Owned For
Owner Type
Purchase Details
Closed on
Dec 7, 2022
Sold by
Leslie R Corpening Trust
Bought by
Wedin Jesse Lee and Otero Cassy Ann
Current Estimated Value
Home Financials for this Owner
Home Financials are based on the most recent Mortgage that was taken out on this home.
Original Mortgage
$486,034
Outstanding Balance
$471,317
Interest Rate
7.08%
Mortgage Type
FHA
Estimated Equity
$71,998
Purchase Details
Closed on
Jul 30, 2020
Sold by
Corpening Leslie R
Bought by
Corpening Leslie R and The Leslie R Corpening Trust
Purchase Details
Closed on
Jun 26, 1998
Sold by
Thomas Samuel P and Thomas Linda K
Bought by
Corpening Melvin D and Corpening Leslie R
Home Financials for this Owner
Home Financials are based on the most recent Mortgage that was taken out on this home.
Original Mortgage
$118,000
Interest Rate
7.17%
Create a Home Valuation Report for This Property
The Home Valuation Report is an in-depth analysis detailing your home's value as well as a comparison with similar homes in the area
Home Values in the Area
Average Home Value in this Area
Purchase History
| Date | Buyer | Sale Price | Title Company |
|---|---|---|---|
| Wedin Jesse Lee | -- | -- | |
| Corpening Leslie R | -- | None Available | |
| Corpening Melvin D | -- | -- |
Source: Public Records
Mortgage History
| Date | Status | Borrower | Loan Amount |
|---|---|---|---|
| Open | Wedin Jesse Lee | $486,034 | |
| Previous Owner | Corpening Melvin D | $118,000 |
Source: Public Records
Tax History Compared to Growth
Tax History
| Year | Tax Paid | Tax Assessment Tax Assessment Total Assessment is a certain percentage of the fair market value that is determined by local assessors to be the total taxable value of land and additions on the property. | Land | Improvement |
|---|---|---|---|---|
| 2025 | $3,337 | $293,700 | $138,369 | $155,331 |
| 2024 | $3,138 | $282,700 | $113,739 | $168,961 |
| 2023 | $3,010 | $497,000 | $215,490 | $281,510 |
| 2022 | $2,948 | $264,000 | $103,104 | $160,896 |
| 2021 | $2,701 | $370,000 | $138,617 | $231,383 |
| 2020 | $2,595 | $327,000 | $128,987 | $198,013 |
| 2019 | $2,455 | $316,000 | $130,442 | $185,558 |
| 2018 | $2,266 | $294,000 | $131,087 | $162,913 |
| 2016 | $1,821 | $134,420 | $33,927 | $100,493 |
| 2015 | $1,775 | $120,505 | $33,927 | $86,578 |
| 2014 | $1,794 | $125,307 | $33,927 | $91,380 |
| 2013 | -- | $110,889 | $29,989 | $80,900 |
Source: Public Records
Map
Nearby Homes
- 548 S 675 W
- 668 W 2300 N
- 324 S 600 W
- 637 W 1600 N
- 239 Lyman Ln
- 234 Leah Cir
- 2257 N 830 W
- Lincoln Farmhouse Plan at Belmont Farms
- Belmont Traditional Plan at Belmont Farms
- Hampton Traditional Plan at Belmont Farms
- 1552 N 200 W
- 2 S 285 W
- 117 Cara Vella Ln
- 235 W 1400 N
- 1410 N 200 W
- 88 W 50 S Unit D-5
- 88 W 50 S Unit C-3
- 88 W 50 S Unit Q12
- 88 W 50 S Unit A4
- 988 W 1950 N Unit 134