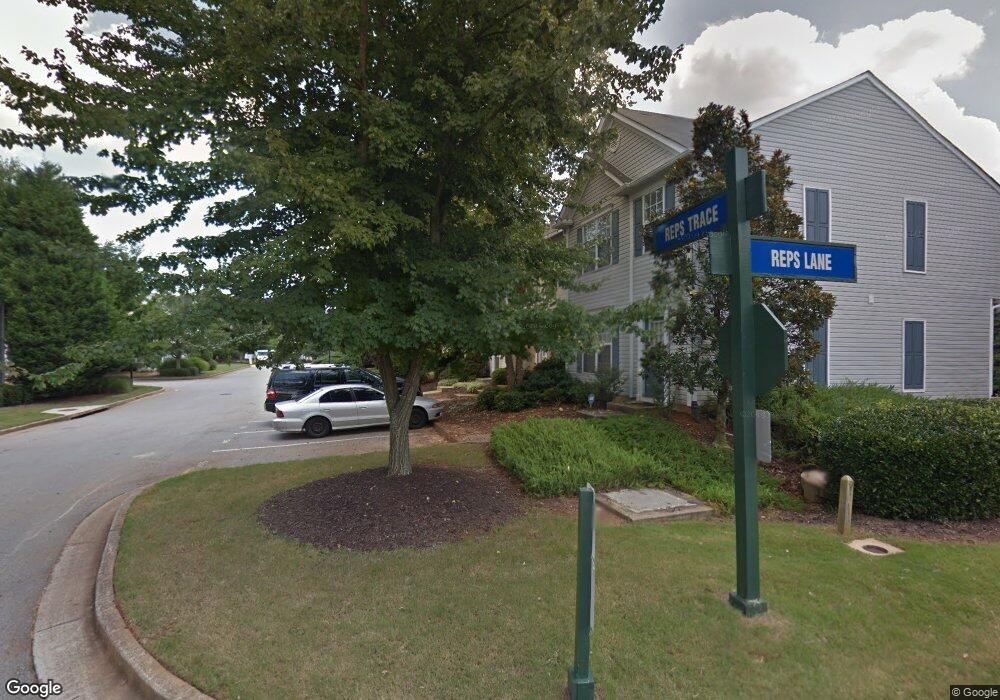
5530 Reps Trace Norcross, GA 30071
Estimated Value: $309,000 - $323,000
3
Beds
3
Baths
1,428
Sq Ft
$221/Sq Ft
Est. Value
About This Home
This home is located at 5530 Reps Trace, Norcross, GA 30071 and is currently estimated at $316,201, approximately $221 per square foot. 5530 Reps Trace is a home located in Gwinnett County with nearby schools including Norcross Elementary School, Summerour Middle School, and Paul Duke STEM High School.
Ownership History
Date
Name
Owned For
Owner Type
Purchase Details
Closed on
Nov 18, 2016
Sold by
Mixson Lee A and Mixson Lucile D
Bought by
Seyoum Tsige T
Current Estimated Value
Home Financials for this Owner
Home Financials are based on the most recent Mortgage that was taken out on this home.
Original Mortgage
$125,915
Outstanding Balance
$101,862
Interest Rate
3.75%
Mortgage Type
FHA
Estimated Equity
$214,339
Purchase Details
Closed on
Oct 26, 2001
Sold by
Nelson Patricia A
Bought by
Pinkerton Patrick M and Pinkerton Gwen D
Home Financials for this Owner
Home Financials are based on the most recent Mortgage that was taken out on this home.
Original Mortgage
$142,900
Interest Rate
6.63%
Purchase Details
Closed on
Dec 29, 1997
Sold by
Canterbury Communities Inc
Bought by
Nelson Patricia A
Home Financials for this Owner
Home Financials are based on the most recent Mortgage that was taken out on this home.
Original Mortgage
$97,200
Interest Rate
7.2%
Create a Home Valuation Report for This Property
The Home Valuation Report is an in-depth analysis detailing your home's value as well as a comparison with similar homes in the area
Home Values in the Area
Average Home Value in this Area
Purchase History
| Date | Buyer | Sale Price | Title Company |
|---|---|---|---|
| Seyoum Tsige T | $137,500 | -- | |
| Pinkerton Patrick M | $142,900 | -- | |
| Nelson Patricia A | $100,200 | -- |
Source: Public Records
Mortgage History
| Date | Status | Borrower | Loan Amount |
|---|---|---|---|
| Open | Seyoum Tsige T | $125,915 | |
| Previous Owner | Pinkerton Patrick M | $142,900 | |
| Previous Owner | Nelson Patricia A | $97,200 |
Source: Public Records
Tax History Compared to Growth
Tax History
| Year | Tax Paid | Tax Assessment Tax Assessment Total Assessment is a certain percentage of the fair market value that is determined by local assessors to be the total taxable value of land and additions on the property. | Land | Improvement |
|---|---|---|---|---|
| 2025 | $3,783 | $119,720 | $28,080 | $91,640 |
| 2024 | $3,914 | $122,320 | $18,400 | $103,920 |
| 2023 | $3,914 | $110,880 | $18,400 | $92,480 |
| 2022 | $4,112 | $98,560 | $18,400 | $80,160 |
| 2021 | $2,662 | $81,160 | $18,400 | $62,760 |
| 2020 | $2,462 | $74,480 | $11,720 | $62,760 |
| 2019 | $2,823 | $65,680 | $11,600 | $54,080 |
| 2018 | $1,821 | $55,000 | $9,600 | $45,400 |
| 2016 | $1,813 | $54,840 | $9,600 | $45,240 |
| 2015 | $2,089 | $48,360 | $9,600 | $38,760 |
| 2014 | -- | $40,000 | $9,600 | $30,400 |
Source: Public Records
Map
Nearby Homes
- 5764 Reps Trace Unit 1
- 5587 Trace Views Dr Unit 8
- 5589 Trace Views Dr
- 505 Cochran Dr
- 3153 Corner Oak Dr
- 3118 Stanstead Ct
- 265 Dogwood Walk Ln Unit 7
- 746 Oak Terrace
- 267 Longview Dr
- 231 Sunset Hills Dr
- 5534 Wynhall Dr
- 2824 Langford Commons Dr
- 3272 Monarch Pine Dr
- 3192 Monarch Pine Dr
- 53 Born St
- 53AND63 Born St
- 435 Webb Dr
- 63 Born St NW
- 204 Wingo St
- 186 Wingo St
- 5530 Reps Trace Unit 5530
- 5524 Reps Trace
- 5534 Reps Trace Unit 3
- 5520 Reps Trace
- 5540 Reps Trace
- 5540 Reps Trace
- 5544 Reps Trace Unit 1
- 5514 Reps Trace
- 5514 Reps Trace Unit 5514
- 5510 Reps Trace Unit 8
- 5510 Reps Trace
- 5510 Reps Trace Unit 5510
- 5250 Reps Trace
- 5254 Reps Trace
- 5254 Reps Trace
- 1867 Reps Trace
- E Reps Trace
- 5260 Reps Trace
- 5260 Reps Trace Unit 5260
- 3005 Reps Miller Rd