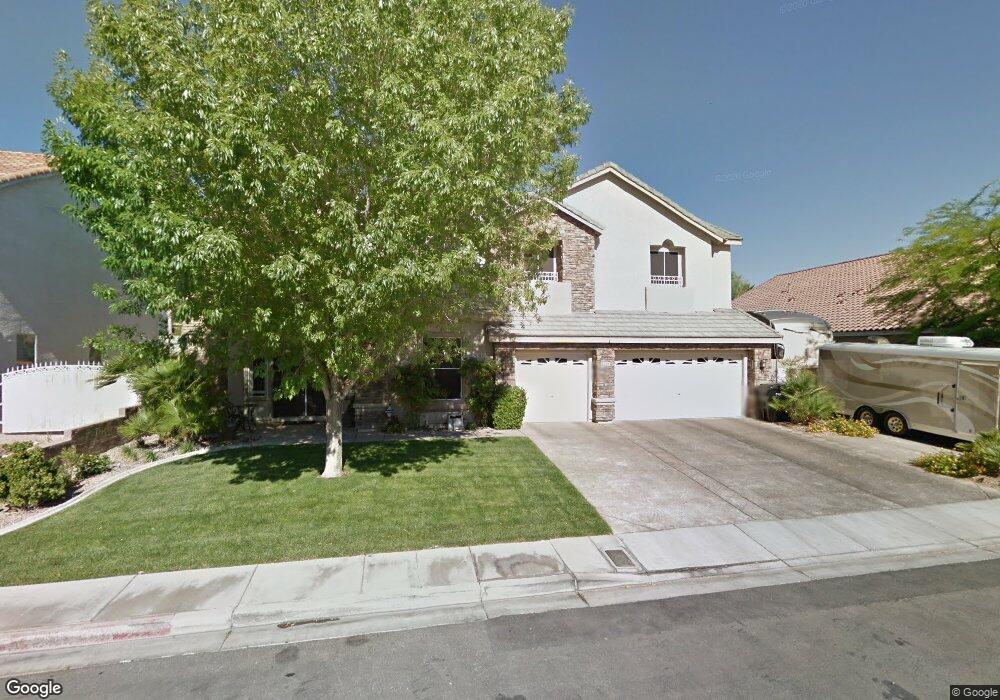
5531 Kings Row Ct Las Vegas, NV 89148
Estimated Value: $822,000 - $949,000
5
Beds
3
Baths
3,862
Sq Ft
$227/Sq Ft
Est. Value
About This Home
This home is located at 5531 Kings Row Ct, Las Vegas, NV 89148 and is currently estimated at $877,594, approximately $227 per square foot. 5531 Kings Row Ct is a home located in Clark County with nearby schools including Kathy L. Batterman Elementary School, Victoria Fertitta Middle School, and Durango High School.
Ownership History
Date
Name
Owned For
Owner Type
Purchase Details
Closed on
Jun 17, 2009
Sold by
Ford Anthony A
Bought by
Ford Anthony A and Ford Susan L
Current Estimated Value
Purchase Details
Closed on
Jun 26, 2002
Sold by
U S Home Corp
Bought by
Ford Harry X and Ford Anthony A
Create a Home Valuation Report for This Property
The Home Valuation Report is an in-depth analysis detailing your home's value as well as a comparison with similar homes in the area
Home Values in the Area
Average Home Value in this Area
Purchase History
| Date | Buyer | Sale Price | Title Company |
|---|---|---|---|
| Ford Anthony A | -- | None Available | |
| Ford Anthony A | -- | None Available | |
| Ford Harry X | $431,078 | Stewart Title |
Source: Public Records
Tax History Compared to Growth
Tax History
| Year | Tax Paid | Tax Assessment Tax Assessment Total Assessment is a certain percentage of the fair market value that is determined by local assessors to be the total taxable value of land and additions on the property. | Land | Improvement |
|---|---|---|---|---|
| 2025 | $4,111 | $226,280 | $63,000 | $163,280 |
| 2024 | $3,992 | $226,280 | $63,000 | $163,280 |
| 2023 | $3,992 | $201,890 | $47,600 | $154,290 |
| 2022 | $3,876 | $188,559 | $47,600 | $140,959 |
| 2021 | $3,763 | $174,168 | $40,250 | $133,918 |
| 2020 | $3,650 | $171,741 | $39,200 | $132,541 |
| 2019 | $3,544 | $167,301 | $36,750 | $130,551 |
| 2018 | $3,441 | $153,550 | $28,350 | $125,200 |
| 2017 | $4,561 | $155,518 | $28,350 | $127,168 |
| 2016 | $3,258 | $133,816 | $20,300 | $113,516 |
| 2015 | $3,252 | $142,340 | $18,550 | $123,790 |
| 2014 | $3,157 | $104,430 | $15,750 | $88,680 |
Source: Public Records
Map
Nearby Homes
- 5554 Chicory Falls Ct
- 9472 W Diablo Dr
- 9687 Ridgebluff Ave
- 9750 Maple Sugar Leaf Place
- 9631 Tuscola Ct
- 5533 Sterling Valley Ct
- 5697 Tapestry Rose Ct
- 9522 Arrowhead Falls Ct
- 9862 Shadow Grove Ave
- 9580 Magnificent Ave
- 9460 Magnificent Ave
- 9731 Cathedral Stairs Ct
- 5526 Spruce Hill Ct
- 9691 Loud Water Way
- 5548 Anshan St
- 9693 Bighorn Island Ave
- 5831 Sleepy Willow St
- 5634 Moccasin Point St
- 5915 Poplar Tree St Unit 7
- 5674 Moccasin Point St
- 5541 Kings Row Ct
- 5521 Kings Row Ct
- 5532 Oakview Falls Ct
- 5542 Oakview Falls Ct
- 5551 Kings Row Ct
- 5511 Kings Row Ct
- 5530 Kings Row Ct Unit 2
- 5540 Kings Row Ct
- 5520 Kings Row Ct
- 5552 Oakview Falls Ct
- 5512 Oakview Falls Ct
- 5550 Kings Row Ct
- 5510 Kings Row Ct
- 5561 Kings Row Ct
- 9547 Aspen Canyon Ct
- 9548 Birch Basin Ct
- 5562 Oakview Falls Ct
- 9546 Aspen Canyon Ct
- 9539 Aspen Canyon Ct
- 9539 Aspen Canyon Ct