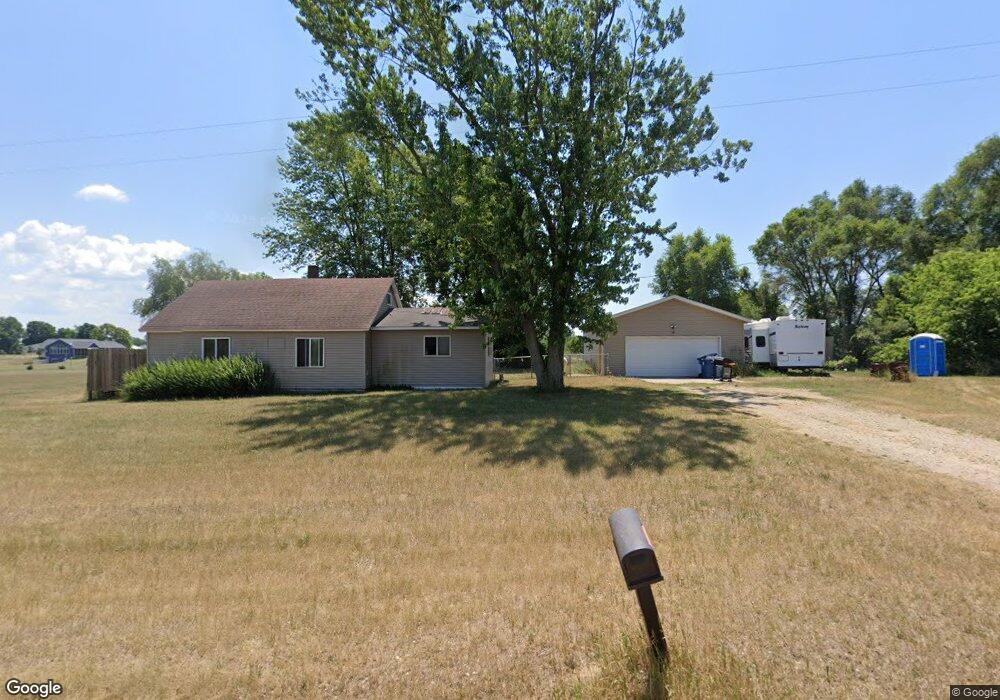
5532 120th Ave Fennville, MI 49408
Estimated Value: $133,000 - $304,000
--
Bed
1
Bath
960
Sq Ft
$200/Sq Ft
Est. Value
About This Home
This home is located at 5532 120th Ave, Fennville, MI 49408 and is currently estimated at $192,393, approximately $200 per square foot. 5532 120th Ave is a home located in Allegan County with nearby schools including Fennville Elementary School, Fennville Middle School, and Fennville High School.
Ownership History
Date
Name
Owned For
Owner Type
Purchase Details
Closed on
Nov 22, 2024
Sold by
Endgelsman Joann Davis and Davis Joann
Bought by
Endgelsman Joann Davis and Engeisman Jeff Charles
Current Estimated Value
Purchase Details
Closed on
Apr 2, 2003
Sold by
Byrne John M and Byrne Carol S
Bought by
Davis David W and Davis Jo Ann
Purchase Details
Closed on
Sep 13, 2001
Sold by
Emerick Danny L and Emerick Mary J
Bought by
Byrne John M and Byrne Carol S
Purchase Details
Closed on
Jul 22, 1993
Sold by
Emerick Danny and Emerick Mary
Bought by
Byrne John and Byrne Carol
Create a Home Valuation Report for This Property
The Home Valuation Report is an in-depth analysis detailing your home's value as well as a comparison with similar homes in the area
Home Values in the Area
Average Home Value in this Area
Purchase History
| Date | Buyer | Sale Price | Title Company |
|---|---|---|---|
| Endgelsman Joann Davis | -- | None Listed On Document | |
| Endgelsman Joann Davis | -- | None Listed On Document | |
| Davis David W | $40,000 | Chicago Title | |
| Byrne John M | $26,500 | Metropolitan Title Company | |
| Byrne John | -- | -- |
Source: Public Records
Tax History Compared to Growth
Tax History
| Year | Tax Paid | Tax Assessment Tax Assessment Total Assessment is a certain percentage of the fair market value that is determined by local assessors to be the total taxable value of land and additions on the property. | Land | Improvement |
|---|---|---|---|---|
| 2025 | $1,129 | $81,700 | $21,400 | $60,300 |
| 2024 | $877 | $65,800 | $19,400 | $46,400 |
| 2023 | $877 | $63,400 | $16,100 | $47,300 |
| 2022 | $877 | $57,400 | $14,500 | $42,900 |
| 2021 | $804 | $54,200 | $13,200 | $41,000 |
| 2020 | $804 | $47,900 | $12,500 | $35,400 |
| 2019 | $804 | $42,900 | $11,300 | $31,600 |
| 2018 | $804 | $38,900 | $11,300 | $27,600 |
| 2017 | $0 | $38,100 | $10,400 | $27,700 |
| 2016 | $0 | $27,100 | $9,500 | $17,600 |
| 2015 | -- | $27,100 | $9,500 | $17,600 |
| 2014 | -- | $26,300 | $9,000 | $17,300 |
| 2013 | -- | $23,400 | $9,000 | $14,400 |
Source: Public Records
Map
Nearby Homes