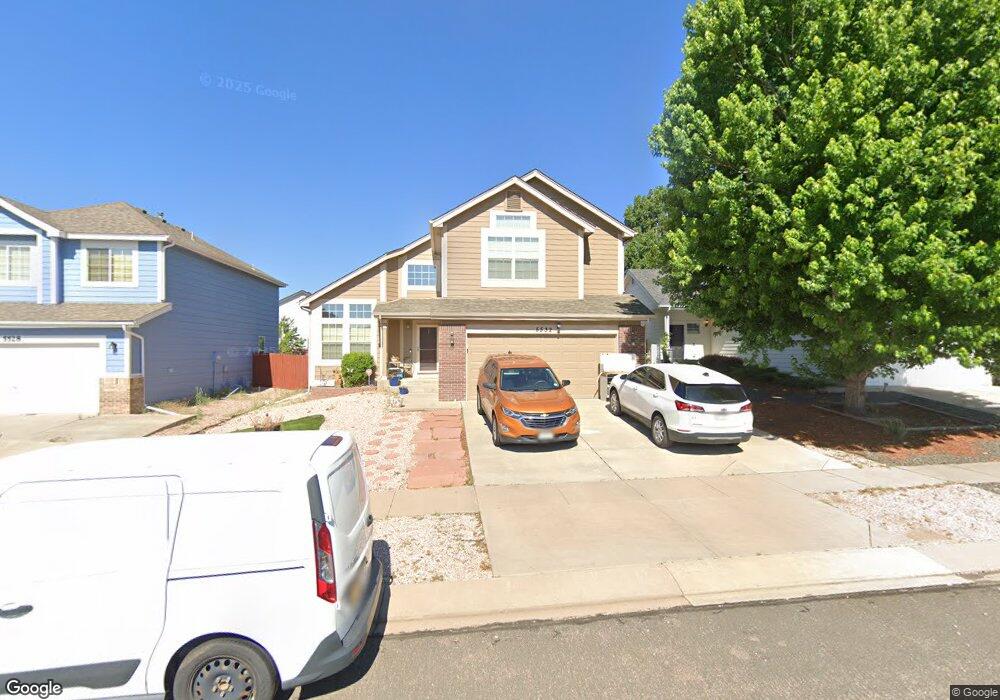
5532 Arroyo St Colorado Springs, CO 80922
Stetson Hills NeighborhoodEstimated Value: $439,031 - $479,000
3
Beds
3
Baths
1,785
Sq Ft
$256/Sq Ft
Est. Value
About This Home
This home is located at 5532 Arroyo St, Colorado Springs, CO 80922 and is currently estimated at $457,008, approximately $256 per square foot. 5532 Arroyo St is a home located in El Paso County with nearby schools including Stetson Elementary School, Skyview Middle School, and Vista Ridge High School.
Ownership History
Date
Name
Owned For
Owner Type
Purchase Details
Closed on
Nov 1, 2012
Sold by
Williams Brandy
Bought by
Williams Brandy and Williams Consuelo
Current Estimated Value
Purchase Details
Closed on
Oct 8, 2007
Sold by
Brooks Chris and Williams Brandy
Bought by
Williams Brandy
Purchase Details
Closed on
Nov 3, 2006
Sold by
Decker Scot and Decker Kim
Bought by
Brooks Chris and Williams Brandy
Home Financials for this Owner
Home Financials are based on the most recent Mortgage that was taken out on this home.
Original Mortgage
$186,400
Outstanding Balance
$110,690
Interest Rate
6.28%
Mortgage Type
Unknown
Estimated Equity
$346,318
Purchase Details
Closed on
Jan 5, 2004
Sold by
Lennar Colorado Llc
Bought by
Decker Scot and Decker Kim
Home Financials for this Owner
Home Financials are based on the most recent Mortgage that was taken out on this home.
Original Mortgage
$19,690
Interest Rate
5.86%
Mortgage Type
Stand Alone Second
Create a Home Valuation Report for This Property
The Home Valuation Report is an in-depth analysis detailing your home's value as well as a comparison with similar homes in the area
Home Values in the Area
Average Home Value in this Area
Purchase History
| Date | Buyer | Sale Price | Title Company |
|---|---|---|---|
| Williams Brandy | -- | None Available | |
| Williams Brandy | -- | None Available | |
| Brooks Chris | $233,000 | None Available | |
| Decker Scot | $196,712 | North American Title |
Source: Public Records
Mortgage History
| Date | Status | Borrower | Loan Amount |
|---|---|---|---|
| Open | Brooks Chris | $186,400 | |
| Previous Owner | Decker Scot | $19,690 | |
| Closed | Decker Scot | $157,350 |
Source: Public Records
Tax History Compared to Growth
Tax History
| Year | Tax Paid | Tax Assessment Tax Assessment Total Assessment is a certain percentage of the fair market value that is determined by local assessors to be the total taxable value of land and additions on the property. | Land | Improvement |
|---|---|---|---|---|
| 2025 | $1,784 | $32,000 | -- | -- |
| 2024 | $1,685 | $32,040 | $4,620 | $27,420 |
| 2023 | $1,685 | $32,040 | $4,620 | $27,420 |
| 2022 | $1,426 | $22,940 | $4,170 | $18,770 |
| 2021 | $1,485 | $23,600 | $4,290 | $19,310 |
| 2020 | $1,318 | $20,710 | $3,580 | $17,130 |
| 2019 | $1,305 | $20,710 | $3,580 | $17,130 |
| 2018 | $1,105 | $17,220 | $3,020 | $14,200 |
| 2017 | $1,111 | $17,220 | $3,020 | $14,200 |
| 2016 | $1,157 | $17,700 | $2,950 | $14,750 |
| 2015 | $1,158 | $17,700 | $2,950 | $14,750 |
| 2014 | $1,007 | $15,110 | $2,790 | $12,320 |
Source: Public Records
Map
Nearby Homes
- 7205 Arrowroot Ave
- 5225 Stone Fence Dr
- 5359 Gentle Wind Rd
- 5424 Thresher Ln
- 5175 Stone Fence Dr
- 5455 Geode Ln
- 7462 Corsicana Dr
- 7533 Amberly Dr
- 7340 Amberly Dr
- 5466 Arden Grove
- 5715 Brennan Ave
- 5352 Freeboot Point
- 5739 Brennan Ave
- 5440 Necker Heights
- 7678 Calypso Dr
- 7882 Tango Ln
- 5477 Passport View
- 5309 Passport View
- 5625 Dusty Chaps Dr
- 5275 Belle Star Dr
- 5536 Arroyo St
- 5528 Arroyo St
- 5439 Stetson Meadows Dr
- 5516 Arroyo St
- 5451 Stetson Meadows Dr
- 5427 Stetson Meadows Dr
- 7421 Steward Ln
- 7415 Steward Ln
- 5463 Stetson Meadows Dr
- 5463R Stetson Meadows Dr
- 5415 Stetson Meadows Dr
- 5463 R Stetson Meadows Dr
- 5531 Arroyo St
- 5535 Arroyo St
- 5527 Arroyo St
- 5403 Stetson Meadows Dr
- 5475 Stetson Meadows Dr
- 5539 Arroyo St
- 5523 Arroyo St
- 5487 Stetson Meadows Dr