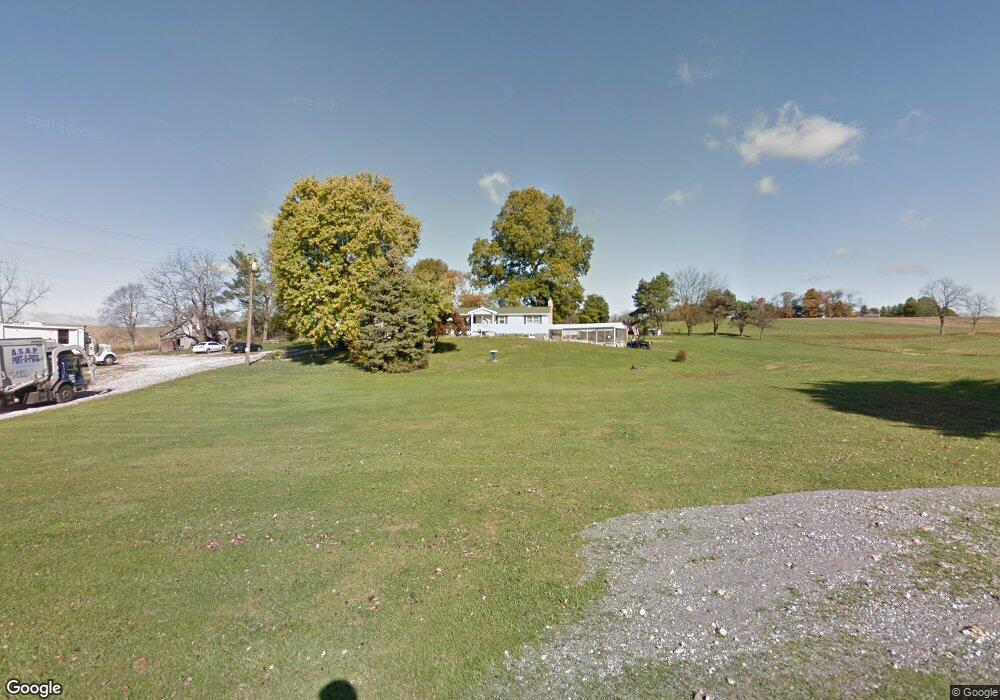
5532 Bethel Rd Woodbine, MD 21797
Estimated Value: $477,000 - $504,000
--
Bed
2
Baths
1,428
Sq Ft
$341/Sq Ft
Est. Value
About This Home
This home is located at 5532 Bethel Rd, Woodbine, MD 21797 and is currently estimated at $486,992, approximately $341 per square foot. 5532 Bethel Rd is a home located in Carroll County with nearby schools including Winfield Elementary School, Mount Airy Middle School, and South Carroll High School.
Ownership History
Date
Name
Owned For
Owner Type
Purchase Details
Closed on
Jul 23, 2015
Sold by
Brown James Edward and Brown Joyce
Bought by
Brown James Edward and Brown Linda Joyce
Current Estimated Value
Home Financials for this Owner
Home Financials are based on the most recent Mortgage that was taken out on this home.
Original Mortgage
$150,000
Outstanding Balance
$117,652
Interest Rate
4.03%
Mortgage Type
New Conventional
Estimated Equity
$369,340
Purchase Details
Closed on
Mar 26, 2014
Sold by
Linton David Leroy
Bought by
Brown James Edward and Brown Linda Joyce
Purchase Details
Closed on
Mar 7, 2014
Sold by
Linton David Leroy
Bought by
Brown James Edward and Brown Linda Joyce
Purchase Details
Closed on
Jun 23, 2011
Sold by
Boehl Teresa Linton
Bought by
Linton David Leroy
Purchase Details
Closed on
May 23, 2011
Sold by
Linton David Leroy and Linton Charlotte Ann
Bought by
Linton David Leroy
Create a Home Valuation Report for This Property
The Home Valuation Report is an in-depth analysis detailing your home's value as well as a comparison with similar homes in the area
Home Values in the Area
Average Home Value in this Area
Purchase History
| Date | Buyer | Sale Price | Title Company |
|---|---|---|---|
| Brown James Edward | -- | Campus Title Company Llc | |
| Brown James Edward | -- | Attorney | |
| Brown James Edward | -- | Attorney | |
| Linton David Leroy | -- | -- | |
| Linton David Leroy | -- | None Available | |
| Linton David Leroy | -- | -- |
Source: Public Records
Mortgage History
| Date | Status | Borrower | Loan Amount |
|---|---|---|---|
| Open | Brown James Edward | $150,000 |
Source: Public Records
Tax History Compared to Growth
Tax History
| Year | Tax Paid | Tax Assessment Tax Assessment Total Assessment is a certain percentage of the fair market value that is determined by local assessors to be the total taxable value of land and additions on the property. | Land | Improvement |
|---|---|---|---|---|
| 2025 | $3,891 | $367,833 | $0 | $0 |
| 2024 | $3,891 | $342,100 | $205,500 | $136,600 |
| 2023 | $3,744 | $329,000 | $0 | $0 |
| 2022 | $3,598 | $315,900 | $0 | $0 |
| 2021 | $7,083 | $302,800 | $165,500 | $137,300 |
| 2020 | $3,391 | $297,467 | $0 | $0 |
| 2019 | $3,361 | $292,133 | $0 | $0 |
| 2018 | $3,272 | $286,800 | $165,500 | $121,300 |
| 2017 | $3,272 | $286,800 | $0 | $0 |
| 2016 | -- | $286,800 | $0 | $0 |
| 2015 | -- | $289,500 | $0 | $0 |
| 2014 | -- | $289,500 | $0 | $0 |
Source: Public Records
Map
Nearby Homes
- The Bristol Plan at Timber Glen
- The Madison Plan at Timber Glen
- The Wellington Plan at Timber Glen
- The Magnolia Plan at Timber Glen
- The Augusta Plan at Timber Glen
- The Cambridge Plan at Timber Glen
- 1103 Cape Ct
- 5134 Perry Rd
- 6119 Davis Rd
- 4950 Crocus Rd
- 2210 Skylark Dr
- 4206 Sequoia Dr
- 0 Cabbage Spring Rd
- 608 Angus Dr
- 970 Oak Tree Rd
- 5307 Pommel Dr
- 5530 Jim Pickett Rd
- 4328 Ridge Rd Unit 13
- 2613 Liberty Rd
- 3008 Arapaho Ct
- 5617 Bethel Rd
- 5435 Bethel Rd
- 5627 Bethel Rd
- 4947 Woodbine Rd
- 5310 Woodbine Rd
- 5492 Bethel Rd
- 5252 Braddock Rd
- 5639 Bethel Rd
- 5358 Woodbine Rd
- 5644 Bethel Rd
- 5348 Woodbine Rd
- 5636 Bethel Rd
- 5244 Braddock Rd
- 5212 Braddock Rd
- 5208 Braddock Rd
- 5407 Woodbine Rd
- 5508 Woodbine Rd
- 5422 Woodbine Rd
- 5526 Woodbine Rd