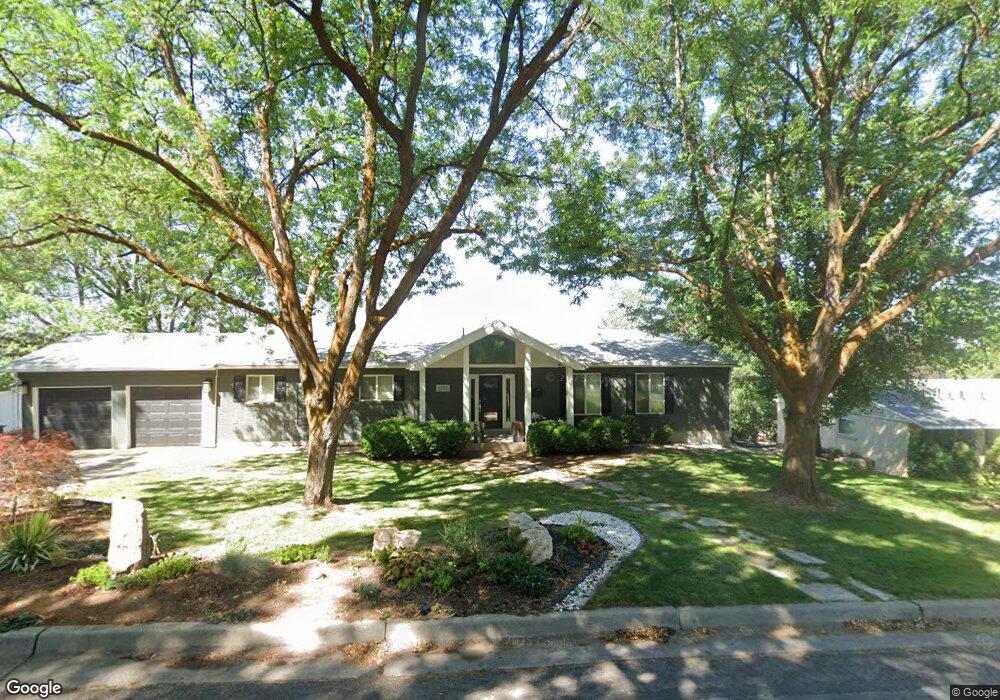
5532 S Wayman Ln Salt Lake City, UT 84117
Estimated Value: $1,147,000 - $1,405,000
6
Beds
4
Baths
3,727
Sq Ft
$341/Sq Ft
Est. Value
About This Home
This home is located at 5532 S Wayman Ln, Salt Lake City, UT 84117 and is currently estimated at $1,270,452, approximately $340 per square foot. 5532 S Wayman Ln is a home located in Salt Lake County with nearby schools including Cottonwood Elementary School, Olympus Junior High School, and Olympus High School.
Ownership History
Date
Name
Owned For
Owner Type
Purchase Details
Closed on
Dec 6, 2016
Sold by
Jaded Bear Investments Llc
Bought by
Alarcon Andres
Current Estimated Value
Home Financials for this Owner
Home Financials are based on the most recent Mortgage that was taken out on this home.
Original Mortgage
$600,300
Outstanding Balance
$483,981
Interest Rate
3.47%
Mortgage Type
New Conventional
Estimated Equity
$786,471
Purchase Details
Closed on
May 9, 2014
Sold by
Woolley Lyman M
Bought by
Jaded Bear Investments Llc
Home Financials for this Owner
Home Financials are based on the most recent Mortgage that was taken out on this home.
Original Mortgage
$289,000
Interest Rate
4.38%
Mortgage Type
New Conventional
Purchase Details
Closed on
Sep 22, 1994
Sold by
Woolley Lyman M and Woolley Mary G
Bought by
Woolley Lyman M and Woolley Mary G
Create a Home Valuation Report for This Property
The Home Valuation Report is an in-depth analysis detailing your home's value as well as a comparison with similar homes in the area
Home Values in the Area
Average Home Value in this Area
Purchase History
| Date | Buyer | Sale Price | Title Company |
|---|---|---|---|
| Alarcon Andres | -- | Vanguard Title Ins | |
| Jaded Bear Investments Llc | -- | Affiliated First Title | |
| Woolley Lyman M | -- | -- |
Source: Public Records
Mortgage History
| Date | Status | Borrower | Loan Amount |
|---|---|---|---|
| Open | Alarcon Andres | $600,300 | |
| Previous Owner | Jaded Bear Investments Llc | $289,000 |
Source: Public Records
Tax History Compared to Growth
Tax History
| Year | Tax Paid | Tax Assessment Tax Assessment Total Assessment is a certain percentage of the fair market value that is determined by local assessors to be the total taxable value of land and additions on the property. | Land | Improvement |
|---|---|---|---|---|
| 2025 | $5,230 | $1,153,100 | $385,700 | $767,400 |
| 2024 | $5,230 | $946,700 | $347,500 | $599,200 |
| 2023 | $5,160 | $910,100 | $334,100 | $576,000 |
| 2022 | $5,238 | $928,400 | $311,800 | $616,600 |
| 2021 | $5,009 | $771,200 | $290,800 | $480,400 |
| 2020 | $4,684 | $714,900 | $290,800 | $424,100 |
| 2019 | $4,638 | $689,400 | $275,600 | $413,800 |
| 2018 | $4,644 | $667,800 | $275,600 | $392,200 |
| 2017 | $4,338 | $658,600 | $275,600 | $383,000 |
| 2016 | $2,400 | $366,300 | $267,700 | $98,600 |
| 2015 | $2,599 | $371,900 | $239,600 | $132,300 |
| 2014 | $2,540 | $355,900 | $234,500 | $121,400 |
Source: Public Records
Map
Nearby Homes
- 2836 E 5495 S
- 2950 E Hillsden Dr
- 5757 S Holladay Blvd
- 3185 Tolcate Hills Dr
- 2550 E Brentwood Dr
- 5508 S Walker Estates Cir
- 2620 E Casto Ln
- 2318 E Walker Ln
- 2633 E Casto Ln
- 2621 E Providence Ct
- 5060 S Mile High Dr
- 2633 E 6200 S Unit 7
- 2633 E 6200 S
- 1757 E Water Pine Ct S Unit 105
- 1749 E Water Pine Ct Unit 102
- 1751 E Water Pine Ct S Unit 103
- 1753 E Water Pine Ct S Unit 104
- 6033 S 2300 E
- 2222 E Walker Ln
- 2227 E 5340 S
- 5532 S Wayman Ln
- 5518 Wayman Ln
- 5548 S Wayman Ln
- 5548 S Wayman Ln
- 2865 Le Jardin Place
- 5518 S Wayman Ln
- 2865 E Le Jardin Place
- 2872 E Le Jardin Place
- 5508 Wayman Ln
- 5533 S Wayman Ln
- 2872 Le Jardin Place
- 5519 Wayman Ln
- 5564 S Wayman Ln
- 5549 S Wayman Ln
- 5508 S Wayman Ln
- 5505 S Holladay Blvd
- 5541 Holladay Blvd
- 2848 Le Jardin Place
- 5549 Wayman Ln
- 5507 S Wayman Ln