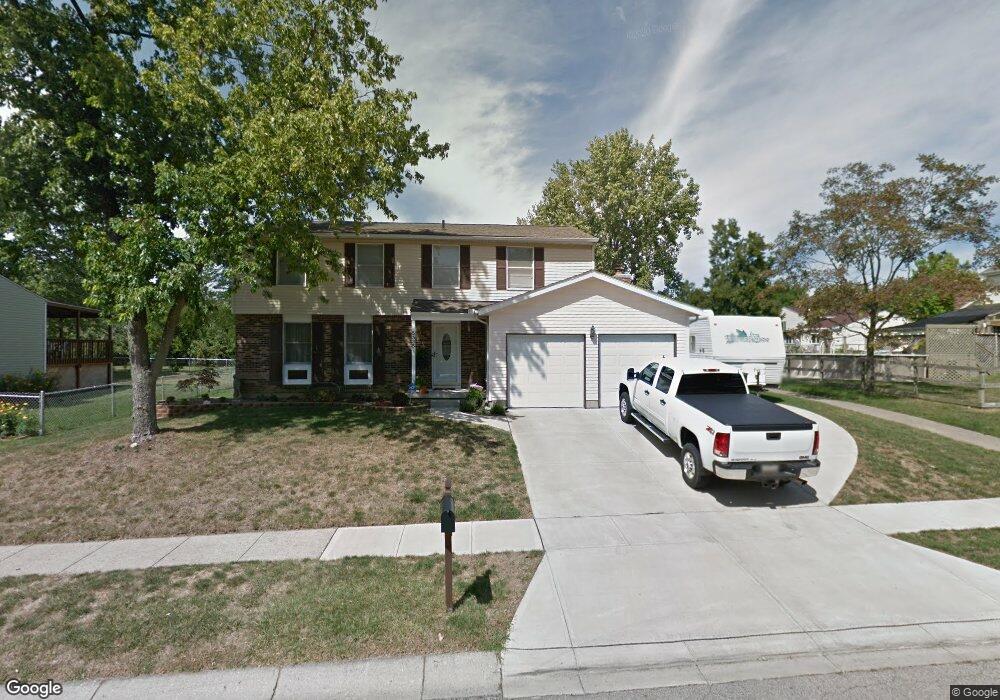
5535 Gander Rd S Dayton, OH 45424
Forest Ridge Quail Hollow NeighborhoodEstimated Value: $269,269 - $294,000
3
Beds
3
Baths
1,919
Sq Ft
$148/Sq Ft
Est. Value
About This Home
This home is located at 5535 Gander Rd S, Dayton, OH 45424 and is currently estimated at $284,317, approximately $148 per square foot. 5535 Gander Rd S is a home located in Montgomery County with nearby schools including Wayne High School, Pathway School of Discovery, and Huber Heights Christian Academy.
Ownership History
Date
Name
Owned For
Owner Type
Purchase Details
Closed on
May 16, 2001
Sold by
Whitney Steven J and Whitney Maxine L
Bought by
Horn David S and Horn Lori A
Current Estimated Value
Home Financials for this Owner
Home Financials are based on the most recent Mortgage that was taken out on this home.
Original Mortgage
$94,600
Outstanding Balance
$35,297
Interest Rate
7.02%
Estimated Equity
$249,020
Purchase Details
Closed on
Jul 9, 1998
Sold by
Whittle Alan N Tr
Bought by
Whitney Steven J and Whitney Maxine L
Home Financials for this Owner
Home Financials are based on the most recent Mortgage that was taken out on this home.
Original Mortgage
$117,756
Interest Rate
6.99%
Mortgage Type
FHA
Purchase Details
Closed on
Mar 13, 1997
Sold by
Whittle Alan N
Bought by
Whittle Alan N
Create a Home Valuation Report for This Property
The Home Valuation Report is an in-depth analysis detailing your home's value as well as a comparison with similar homes in the area
Home Values in the Area
Average Home Value in this Area
Purchase History
| Date | Buyer | Sale Price | Title Company |
|---|---|---|---|
| Horn David S | $128,600 | -- | |
| Whitney Steven J | $119,900 | -- | |
| Whitney Steven J | $119,900 | Summit Land Title Agency Inc | |
| Whitney Steven J | $119,900 | -- | |
| Whittle Alan N | -- | -- | |
| Whittle Alan N | -- | -- |
Source: Public Records
Mortgage History
| Date | Status | Borrower | Loan Amount |
|---|---|---|---|
| Open | Horn David S | $94,600 | |
| Previous Owner | Whitney Steven J | $117,756 |
Source: Public Records
Tax History Compared to Growth
Tax History
| Year | Tax Paid | Tax Assessment Tax Assessment Total Assessment is a certain percentage of the fair market value that is determined by local assessors to be the total taxable value of land and additions on the property. | Land | Improvement |
|---|---|---|---|---|
| 2024 | $4,035 | $71,120 | $14,410 | $56,710 |
| 2023 | $4,035 | $71,120 | $14,410 | $56,710 |
| 2022 | $3,576 | $50,800 | $10,290 | $40,510 |
| 2021 | $3,586 | $50,800 | $10,290 | $40,510 |
| 2020 | $3,590 | $50,800 | $10,290 | $40,510 |
| 2019 | $3,566 | $44,490 | $9,800 | $34,690 |
| 2018 | $3,577 | $44,490 | $9,800 | $34,690 |
| 2017 | $3,554 | $44,490 | $9,800 | $34,690 |
| 2016 | $3,386 | $41,410 | $9,800 | $31,610 |
| 2015 | $3,345 | $41,410 | $9,800 | $31,610 |
| 2014 | $3,345 | $41,410 | $9,800 | $31,610 |
| 2012 | -- | $43,420 | $9,800 | $33,620 |
Source: Public Records
Map
Nearby Homes
- 4048 Quail Bush Dr
- 5540 Signet Dr
- 4426 Rainbrook Way
- 2757 Amberwood Dr Unit 17-300
- 4403 Woodpoint Ct
- 4521 Willow Mist Dr
- 4799 Blue Spruce Ct
- 5818 Royal Palm Ct
- 4418 Woodpoint Ct
- 4734 Willow Mist Dr
- 4830 Leafburrow Dr
- 4731 Blue Spruce Ct
- 0 Forest Ridge Blvd Unit 937866
- 4222 Meadowsweet Dr
- 5612 Kitridge Rd
- 6286 Pheasant Hill Rd
- 4750 Whitewood Ct
- 6303 Copper Pheasant Dr
- 4288 Dobbin Cir
- 4294 Dobbin Cir
- 5525 Gander Rd S
- 5293 Grouse Ct
- 5301 Grouse Ct
- 5515 Gander Rd S
- 5530 Gander Rd S
- 5540 Gander Rd S
- 5520 Gander Rd S
- 5550 Gander Rd S
- 5510 Gander Rd S
- 5317 Grouse Ct
- 5505 Gander Rd S
- 4502 Falcon Cir
- 4503 Falcon Cir
- 5560 Gander Rd S
- 5294 Grouse Ct
- 4107 Quail Bush Dr
- 4113 Quail Bush Dr
- 5302 Grouse Ct
- 4101 Quail Bush Dr
- 5500 Gander Rd S