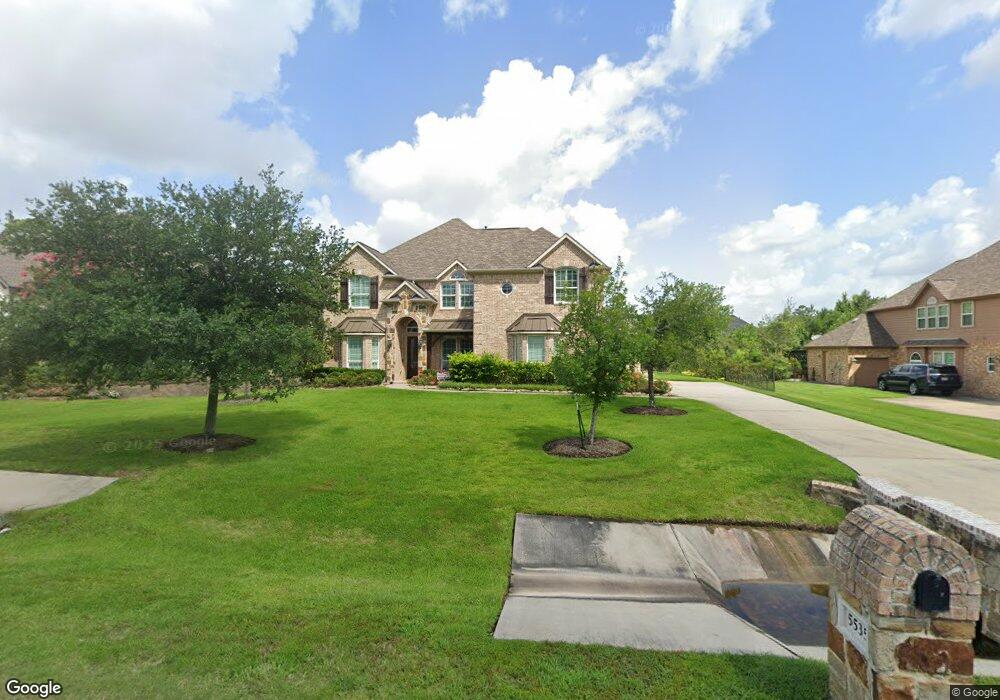
5535 Harvest Oak Landing Dr Spring, TX 77386
Benders Landing NeighborhoodEstimated Value: $850,386 - $1,137,000
4
Beds
4
Baths
3,830
Sq Ft
$251/Sq Ft
Est. Value
About This Home
This home is located at 5535 Harvest Oak Landing Dr, Spring, TX 77386 and is currently estimated at $959,597, approximately $250 per square foot. 5535 Harvest Oak Landing Dr is a home located in Montgomery County with nearby schools including York J High School and Grand Oaks High School.
Ownership History
Date
Name
Owned For
Owner Type
Purchase Details
Closed on
Dec 12, 2014
Sold by
First Texas Homes Inc
Bought by
Farrell Kelly and Farrell Louis
Current Estimated Value
Home Financials for this Owner
Home Financials are based on the most recent Mortgage that was taken out on this home.
Original Mortgage
$417,000
Outstanding Balance
$320,025
Interest Rate
4.05%
Mortgage Type
New Conventional
Estimated Equity
$639,573
Purchase Details
Closed on
Apr 12, 2012
Sold by
Schwartzenburg Sean and Schwartzenburg Stephanie
Bought by
Ferrell Louis and Ferrell Kelly
Purchase Details
Closed on
Sep 29, 2008
Sold by
Lgi Land Llc
Bought by
Schwartzenburg Sean and Schwartzenburg Stephanie
Home Financials for this Owner
Home Financials are based on the most recent Mortgage that was taken out on this home.
Original Mortgage
$39,920
Interest Rate
6.99%
Mortgage Type
Purchase Money Mortgage
Create a Home Valuation Report for This Property
The Home Valuation Report is an in-depth analysis detailing your home's value as well as a comparison with similar homes in the area
Home Values in the Area
Average Home Value in this Area
Purchase History
| Date | Buyer | Sale Price | Title Company |
|---|---|---|---|
| Farrell Kelly | -- | Capital Title | |
| Ferrell Louis | -- | -- | |
| Ferrell Louis | -- | -- | |
| Schwartzenburg Sean | -- | American Title Company | |
| Ferrell Louis | -- | -- |
Source: Public Records
Mortgage History
| Date | Status | Borrower | Loan Amount |
|---|---|---|---|
| Open | Ferrell Louis | $417,000 | |
| Closed | Ferrell Louis | $83,400 | |
| Closed | Farrell Kelly | $417,000 | |
| Previous Owner | Ferrell Louis | $39,920 |
Source: Public Records
Tax History Compared to Growth
Tax History
| Year | Tax Paid | Tax Assessment Tax Assessment Total Assessment is a certain percentage of the fair market value that is determined by local assessors to be the total taxable value of land and additions on the property. | Land | Improvement |
|---|---|---|---|---|
| 2025 | $10,649 | $864,498 | -- | -- |
| 2024 | $9,573 | $785,907 | -- | -- |
| 2023 | $9,573 | $714,460 | $155,110 | $631,940 |
| 2022 | $11,270 | $649,510 | $118,710 | $555,870 |
| 2021 | $10,916 | $590,460 | $72,380 | $518,080 |
| 2020 | $10,611 | $545,790 | $72,380 | $473,410 |
| 2019 | $10,450 | $518,760 | $72,380 | $446,380 |
| 2018 | $9,119 | $497,320 | $72,380 | $424,940 |
| 2017 | $10,179 | $506,010 | $72,380 | $433,630 |
| 2016 | $10,179 | $506,010 | $72,380 | $433,630 |
| 2015 | $6,512 | $506,010 | $72,380 | $433,630 |
| 2014 | $6,512 | $320,470 | $49,400 | $271,070 |
Source: Public Records
Map
Nearby Homes
- 27919 Inspire Crest Landing
- 5514 Harvest Oak Landing Dr
- 28337 Sterling Oak Dr
- 5361 Cherry Spring Dr
- 5217 Liberty Cove Dr
- 28228 Cedar Peak Dr
- 28212 Cedar Peak Dr
- 28295 Emerald Bend
- 4603 Silver Moon Dr
- 4911 Ontonagon Way
- 27919 Hansons Ct
- 4582 Silver Moon Dr
- 27322 Whispering Maple Way
- 4904 Northern Woods Dr
- 4527 Silver Moon Dr
- 27918 Hansons Ct
- 27318 Whispering Maple Way
- 27618 Siandra Creek Ln
- 4349 Victoria Pine Dr
- 4345 Victoria Pine Dr
- 5539 Harvest Oak Landing Dr
- 5531 Harvest Oak Landing Dr
- 27922 E Benders Landing Blvd
- 5530 Harvest Oak Landing Dr
- 5543 Harvest Oak Landing Dr
- 5526 Harvest Oak Landing Dr
- 27918 Inspire Crest
- 28458 Sunrise View Dr
- 28454 Sunrise View Dr
- 28450 Sunrise View Dr
- 28462 Sunrise View Dr
- 27918 Inspire Crest Ln
- 28446 Sunrise View Dr
- 28464 Sunrise View Dr
- 28442 Sunrise View Dr
- 28470 Sunrise View Dr
- 5520 Harvest Oak Landing Dr
- 28438 Sunrise View Dr
- 28474 Sunrise View Dr
- 5603 Bright Timber Landing Dr